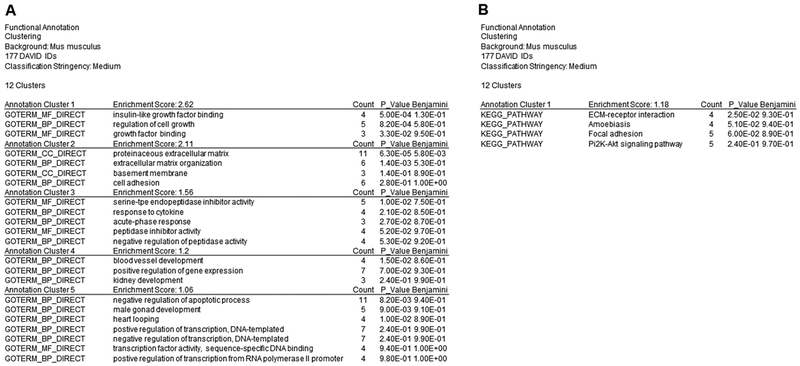
Figure 1.
Data obtained from the RNA sequencing were functionally analyzed using The Database of Annotation, Visualization, and Integrated Discovery (DAVID) Bioinformatics version 6.8. A total of 177 genes were entered into DAVID (false discovery rate < 0.62 and p < 0.007) for functional annotation analysis. “Gene_Ontology” results yield 5 annotation clusters (A) and “Pathways” results yield 1 annotation cluster (B) with a significant enrichment score ≥ 1.

