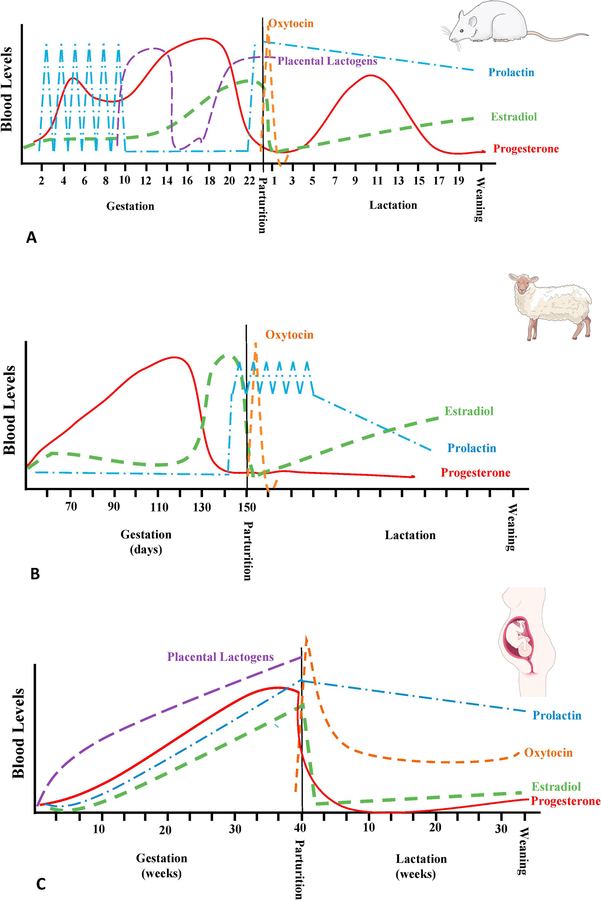
Figure 1.
Schematic representation of relative variation of Estradiol (----), Progesterone (—), prolactin (−.−.), oxytocine (……) and placental lactogens (----) during gestation, parturition and lactation. These variations are presented for rats (A), sheep (B) and human (C) for comparison. Images of rat, sheep and human were obtained from Servier Medical Art (https://smart.servier.com/)

