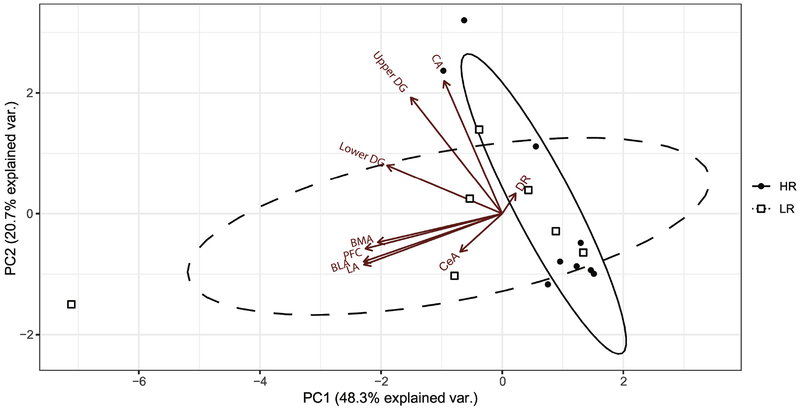
Figure 6. Principle Component Analysis (PCA) Biplot of COX data in adult HR/LR limbic brain.
PCA was used to examine inter-correlations between COX activity measures across the amygdala, hippocampus, prefrontal cortex, and dorsal raphe or HR/LR rats by reducing the data into two major components of variance – Principle Components (PC) 1 and 2. PC1 (shown on x-axis) explains 48.3% of the variation observed in COX activity within HR/LR brain regions. PC2 (shown on y-axis) explains 20.7% of the variation in COX activity within HR/LR brain regions. Arrows labelled with different brain regions represent vectors that indicate direction and magnitude of variation of COX data for each brain region. The solid black line ellipse represents the range of HR samples (individual animals shown in small black-filled circles). The dashed-line ellipse represents the range of the LR samples (individual animals shown in small open squares). The distinct shape and spread of the HR vs. LR ellipses illustrates the COX differences and differential regional inter-relatedness between phenotypes. Abbreviations: lateral amygdala (LA); basolateral amygdala (BLA); basomedial amygdala (BMA); central amygdala (CeA); DG, dentate gyrus; CA, cornu ammonis; dorsal raphe (DR); Prl, prelimbic cortex. See supplementary material for eigenvector loadings on PC1 and PC2.

