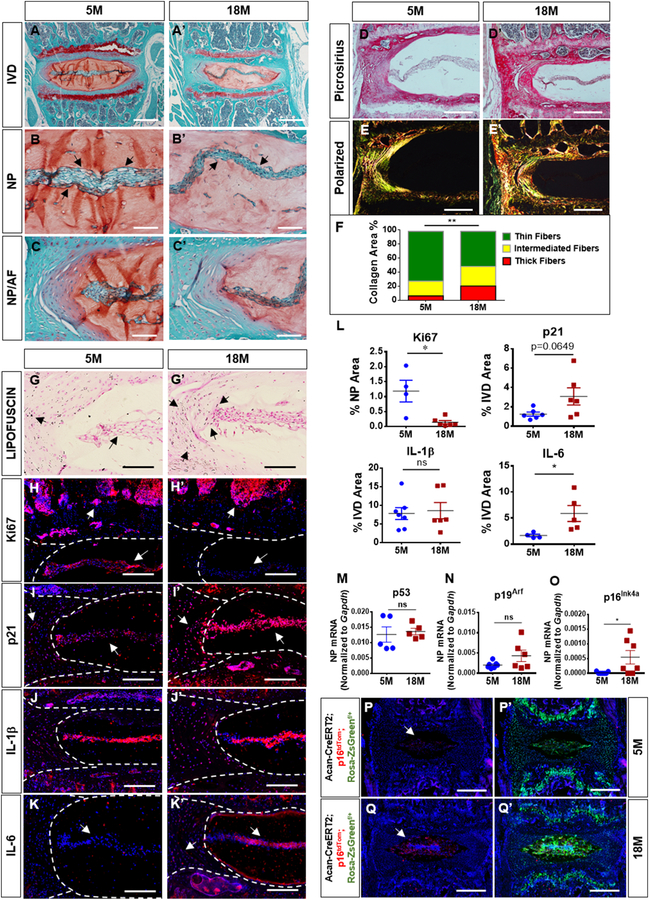
Figure 1. Senescence and p16Ink4a expression increase with age. (A-C’).
18-month-old mice showed a decrease in vacuoles and cell band width (arrows) and comparable features of the NP/AF junction. (D-F) Picrosirius red staining (D-D’) and quantitative polarized imaging (E, E’) showed a decrease in thin collagen fibers along with an increase of medium and thick fibers compare to 5-month-old mice (F). P < 0.05, χ2 test, N = 4–6 mice/group, 4 discs/animal. (G-G’) Sudan-Black-B staining showed an increase in Lipofuscin aggregates deposition in NP and AF of old mice (arrows). (H-I’) There was a significant decrease in Ki67 and an increase of p21 expression in all disc compartments (arrows). (J-J’) Analysis of SASP showed comparable levels of IL-1β with aging. (K-K’) IL-6 expression was significantly higher in the older mice. (L) Quantification of % positive staining for KI67, p21, IL-1β and IL-6 expression. (M-N) p53 and p19Arf mRNA levels were similar between 5-and 18-month old mice(O) p16Ink4amRNA levels were significantly higher in 18-month old mice compared to 5-month old animals.(P-Q’) Acantm1(cre/ERT2)Crm; p16tdTom;Rosa-ZsGreen 18-month-old mice showed robust expression of p16Ink4a (tdTOM/Red) in the NP with strong colocalization with Aggrecan-Cre positive cells (ZsGreen), p16Ink4a levels were low in 5-moth-old mice. For quantitative immunohistology and RNA analysis, Mann-Whitney test was used for comparing differences between the groups. NS = not significant; p ≤ 0.05 *; p ≤ 0.01 **; N=6 animals/genotype were analyzed. Scale bar A-A’, P-Q’ = 200 µm; Scale bar B-E’’, G-K’ = 50 µm.

