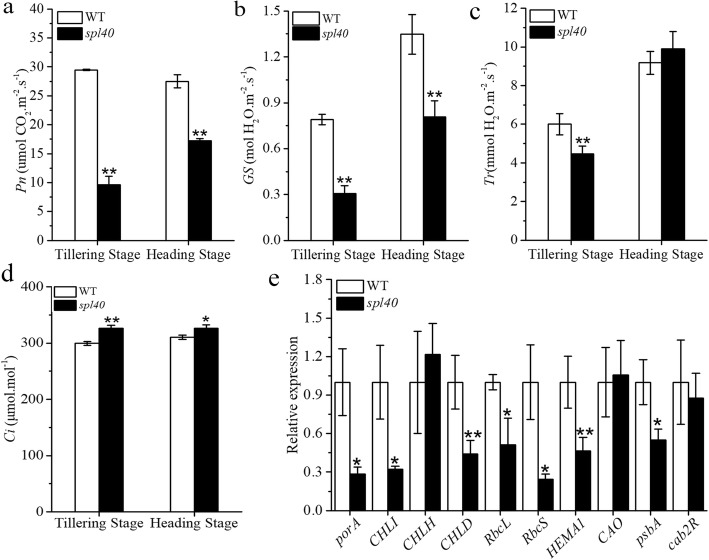
Fig. 2.
Photosynthesis parameters of leaves at the tillering and heading stages. a Net photosynthetic rate (Pn). b Stomatal conductance (Gs). c Transpiration rate (Tr). d Intercellular CO2 concentration (Ci). e Expression profile of photosynthesis related genes in spl40 and WT at tillering stage. Values are means ± SD (n = 3); ** indicates significance at P ≤ 0.01 and * indicates significance at P ≤ 0.05 by Student’s t test

