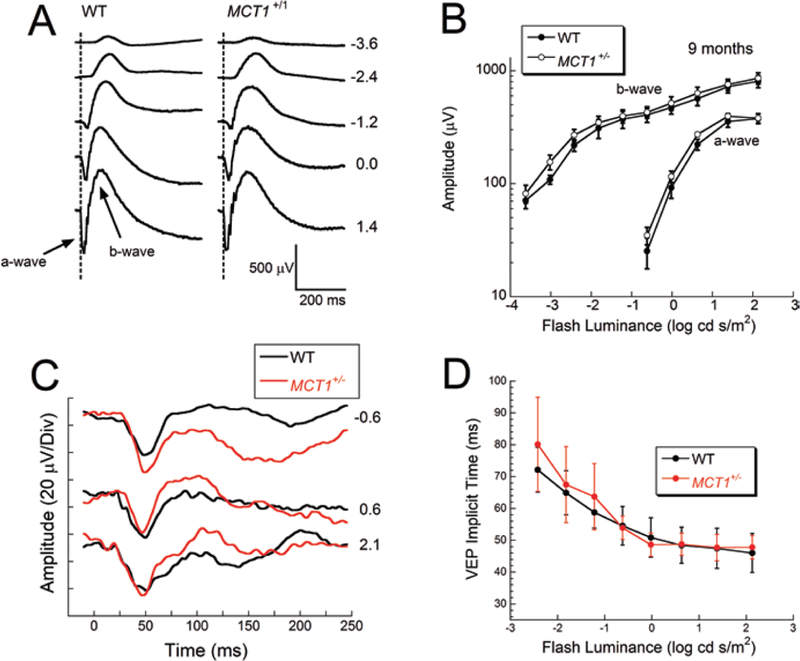
Fig. 46.2.

Normal visual electrophysiology in MCT1+/− mice. (a) Dark-adapted ERGs obtained from 9-month-old MCT1+/− and WT littermates. (b) Amplitude of the major components of the dark-adapted ERG. Data points indicate average ± sem from four mice per genotype. (c) VEPs obtained from 8-month-old MCT1+/− and WT littermates. (d) Implicit time of the major VEP component plotted as a function of flash luminance. Data points indicate average ± sem from 15 WT and 11 MCT1+/− mice
