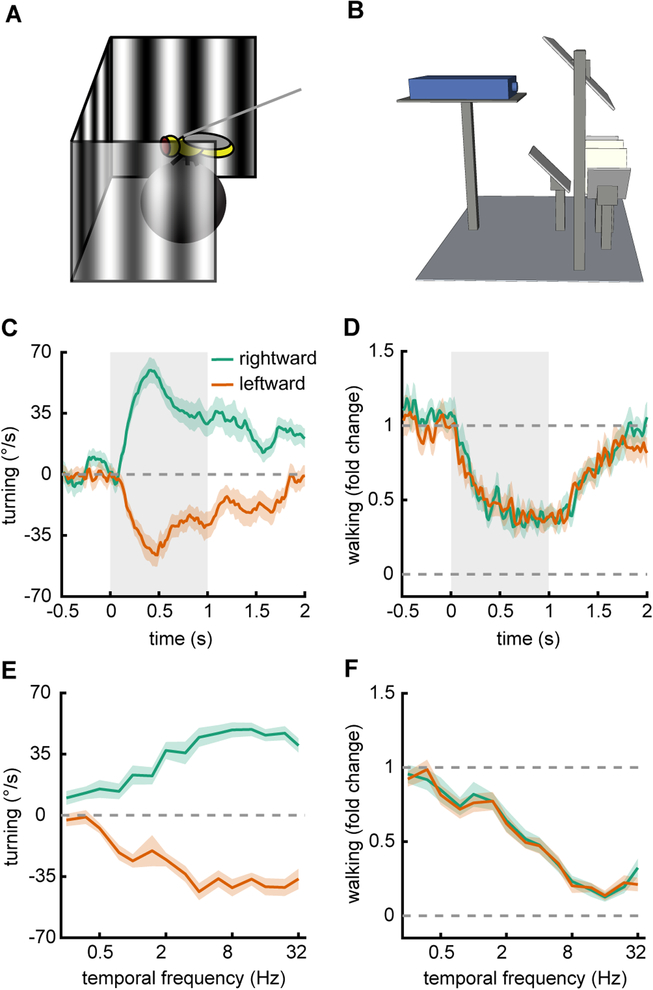
Figure 2.
Moderate throughput optomotor behavior measurements in 40 individual flies. A) Schematic of a fly on a ball being presented with drifting sine wave gratings.
B) Diagram of the full set up as in Figure 1A.
C) Average rotational time traces for flies presented with sine waves gratings that move leftward or rightward for durations of 1 second (spatial wavelength 60°, temporal frequency 2 Hz, contrast 25%). Shaded regions represent ± SEM.
D) Same as in (C), but measuring the normalized walking speed of the flies.
E) Rotational responses of flies, averaged over the presentation duration, plotted for drifting gratings with several different temporal frequencies.
F) Same as in (E), but measuring the relative walking speed of the flies.

