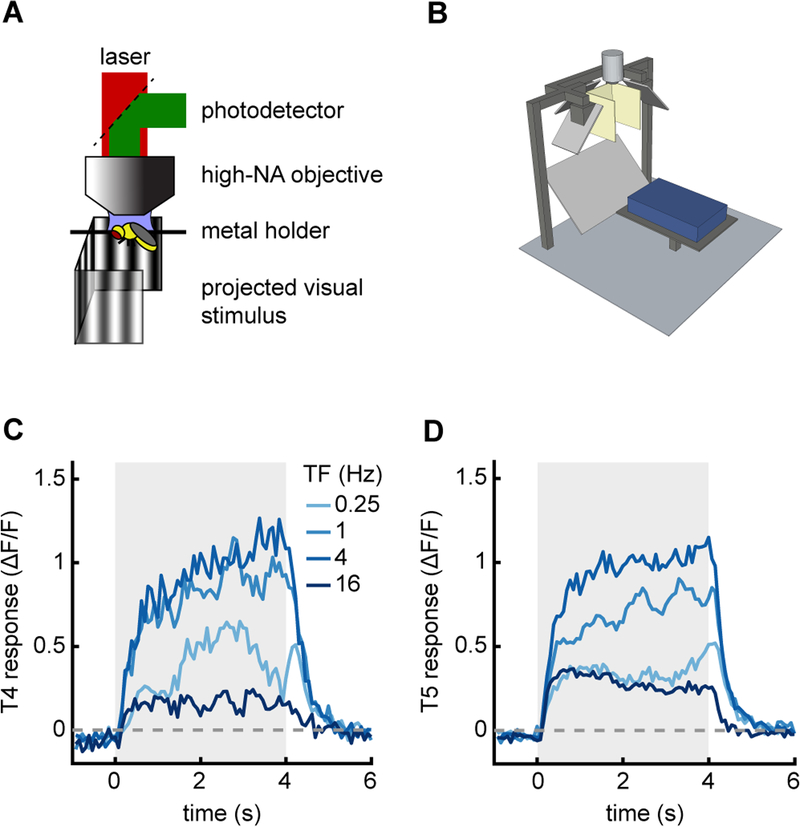
Figure 4.
Stimulus device used with two-photon microscopy. A) Diagram of two-photon setup.
B) Model of panoramic display under microscope objective.
C) Average response of T4 cells when presented with drifting sine wave gratings of different temporal frequencies (wavelength 60° and contrast 50%). The temporal frequency of the stimulus is denoted by line color. Stimulus presentation lasted for 4 seconds.
D) As in (C), but measured from T5 cells.

