Figure 1.

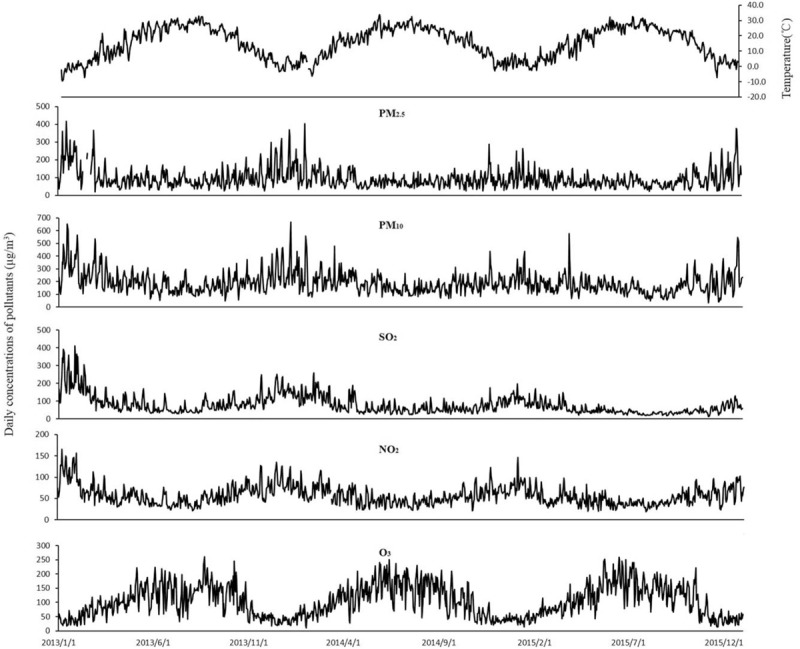
The temporal distribution of daily average ambient pollutant concentrations and daily mean temperature in Jinan during 2013 to 2015.

The temporal distribution of daily average ambient pollutant concentrations and daily mean temperature in Jinan during 2013 to 2015.