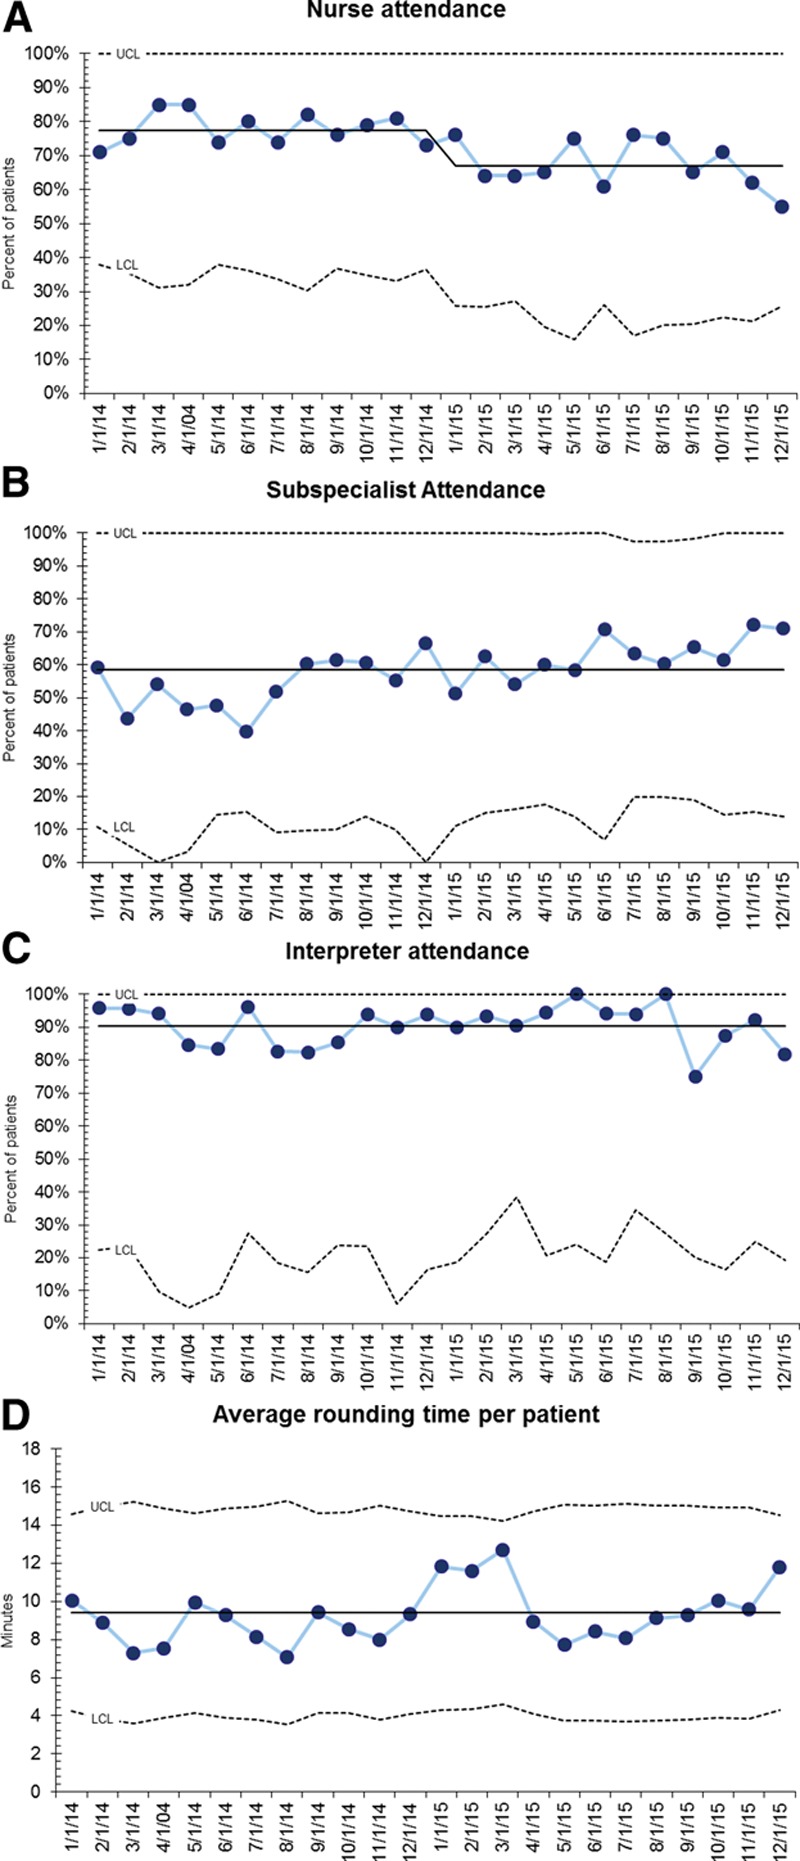
Fig. 3.

Process metrics after implementation of aFCR. A,. Nurse attendance (% of patients for whom nurse was present). B, Subspecialist attendance (% of patients for whom subspecialist was present if requested). C, Interpreter attendance (% of patients for whom interpreter was present if requested). D, Average rounding time per patient (minutes).
