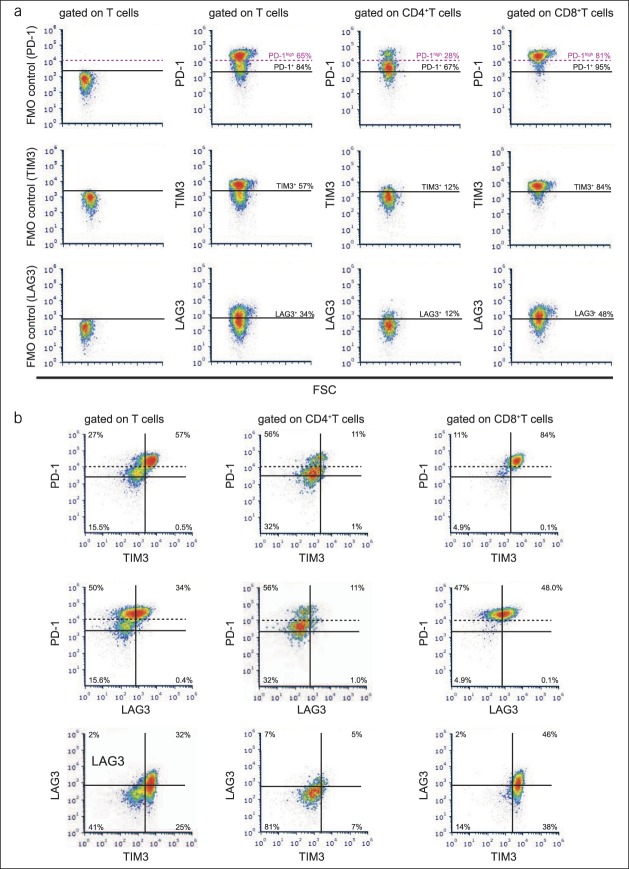
Figure 4.
TIM3 and LAG3 expressions are predominantly observed in PD1high intratumoral CD8+ T cells in advanced HCC. (a) Representative flow cytometry plots of immune checkpoint molecules, including FMO controls. (b) Coexpression patterns of PD-1, TIM3, and LAG3 in the intratumoral T cells of patients with advanced HCC. FSC, forward scatter; FMO, fluorescence minus one; HCC, hepatocellular carcinoma; PD, programmed death.

