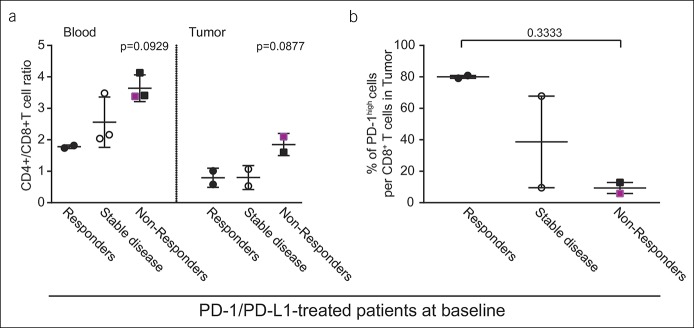
Figure 6.
T-cell status in PD-1/PD-L1 pathway blockade-treated patients at the baseline. (a) CD4+/CD8+ T-cell ratio in the blood and tumor tissues at the baseline and (b) intratumoral frequency of PD-1high CD8+ T cells at the baseline of the patients who later responded to PD-1/PD-L1 therapy (n = 2), display stable disease (n = 3/2), or those who were nonresponders (n = 2). Fuchsia denotes a patient with anti-PD-1 antibody as the first-line treatment, whereas black denotes a patient with anti-PD-1/PD-L1 treatment as the second-line treatment after sorafenib. Each dot represents a patient; mean ± SE. PD, programmed death.

