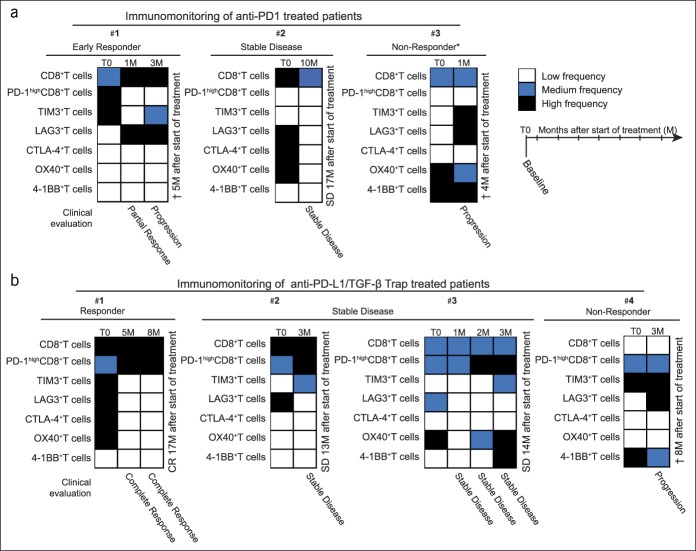
Figure 7.
Immunomonitoring of PD-1/PD-L1 pathway blockade-treated patients in the blood. (a) Immunomonitoring of patients treated with anti-PD-1 antibody (n = 3). (b) Immunomonitoring of patients treated with anti-PD-L1/TGF-β Trap (n = 4); T0, baseline; M, month after the start of treatment. Results are expressed as a heat map-based frequency of positive cells compared with the mean frequency of a corresponding subpopulation of the entire cohort at the baseline (T0): low (white; <mean, −20%), medium (blue; mean, ±20%), and high (black; >mean, +20%). *Anti-PD-1 antibody as the first-line treatment; the rest were second-line treatments after sorafenib. PD, programmed death.

