
Figure 5.
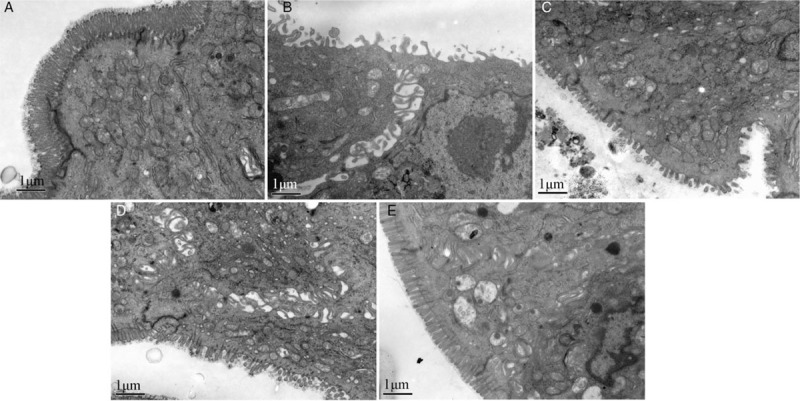
Tight junctions and inter-cellular space from normal control group (A), colitis model group (B), Sb treatment group (C), mesalazine treatment group (D), and combination treatment group (E) under transmission electron microscope. Scale bar = 1 μm. Sb: Saccharomyces boulardii.