Figure 3.

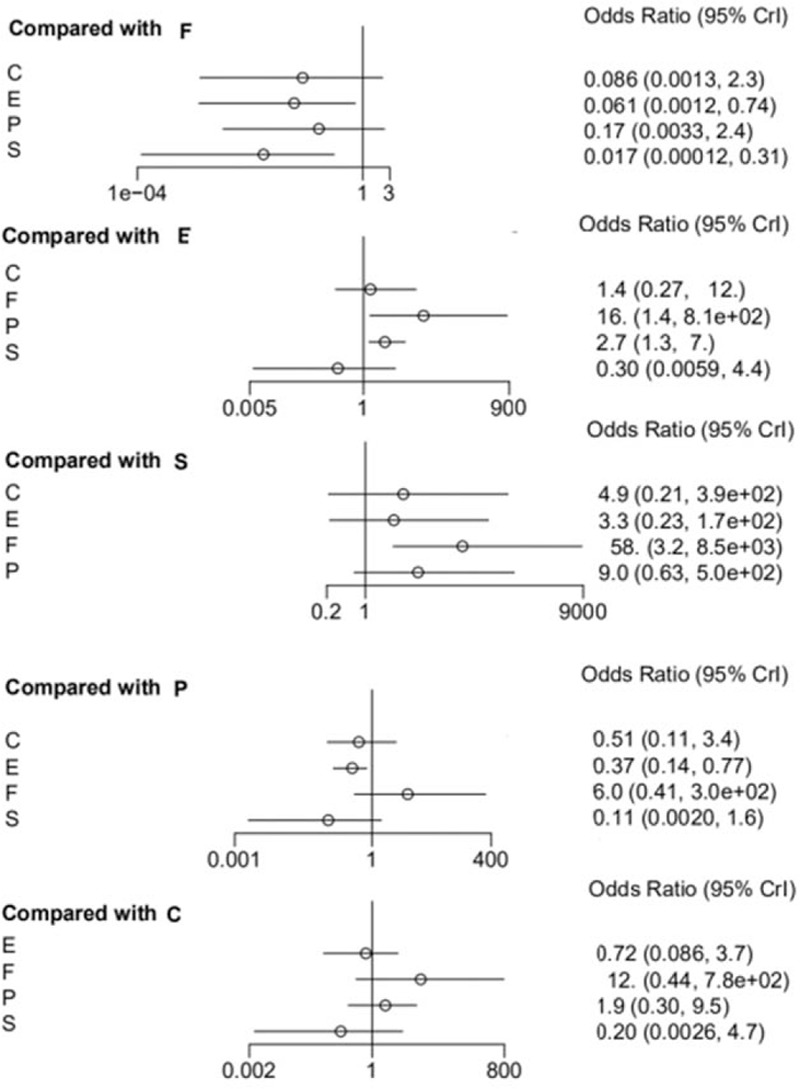
The forest plot of network results on the incidence of CDR. C = Citalopram, E = Escitalopram, F = Fluoxetine, P = Paroxetine, S = Sertraline.

The forest plot of network results on the incidence of CDR. C = Citalopram, E = Escitalopram, F = Fluoxetine, P = Paroxetine, S = Sertraline.