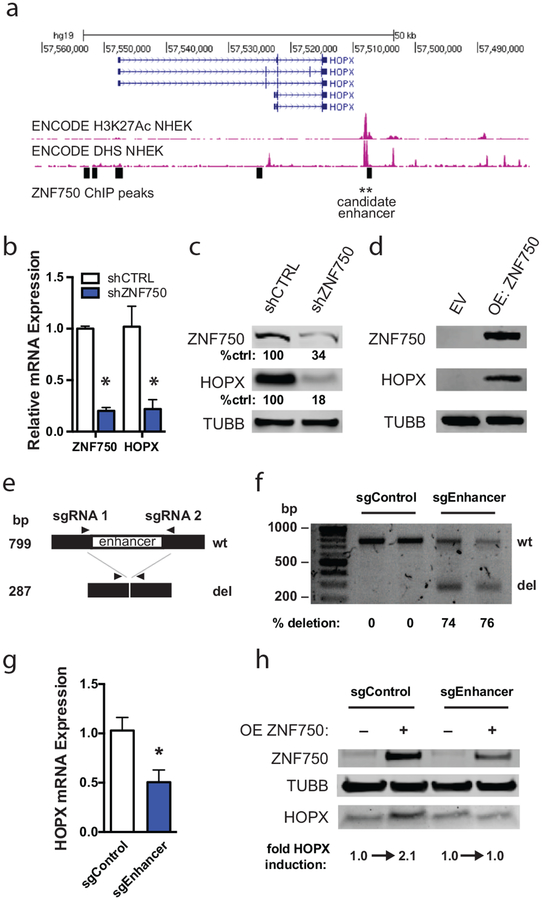
Figure 1. HOPX is induced by ZNF750 binding at a downstream enhancer.
(A) Chromatin immunoprecipitation-sequencing tracks around the HOPX genomic locus. ZNF750 binding sites are represented as black rectangles. Histone 3, lysine 27 acetylation = H3K27Ac. DNase hypersensitivity site = DHS. (B) Quantitative RT-PCR of control and ZNF750-depleted (shZNF750) keratinocytes differentiated for 6 days. n=2, error bars=SEM. * p<0.05. (C) Western blot of day 5 differentiated keratinocytes following short hairpin RNA-induced depletion of ZNF750 (shZNF750). Quantitation of band intensity performed using Li-Cor software. Band intensities were normalized to loading control and shCTRL band intensity. (D) Western blot of keratinocytes transduced to overexpress ZNF750 (OE ZNF750). Keratinocytes were infected with empty vector (EV) or ZNF750-HA. (E) Scheme of CRISPR/Cas9-mediated enhancer deletion and detection by PCR assay. (F) PCR assay to detect HOPX enhancer deletion. Cas9 was introduced into keratinocytes along with single guide RNAs flanking the candidate enhancer (sgEnhancer) or scramble control guides (sgControl). Quantitation of band intensity was performed using Bio-Rad Image Lab™ Software analysis. Band intensities were normalized to amplicon length to determine relative deletion efficiency. (G) Quantitative RT-PCR of HOPX expression in control and enhancer-deleted pooled differentiated keratinocytes. n=3, error bars=SEM. * p<0.05. (H) Western blot of differentiating sgControl and sgEnhancer keratinocytes transduced to overexpress ZNF750. Quantification was performed using LiCor software.

