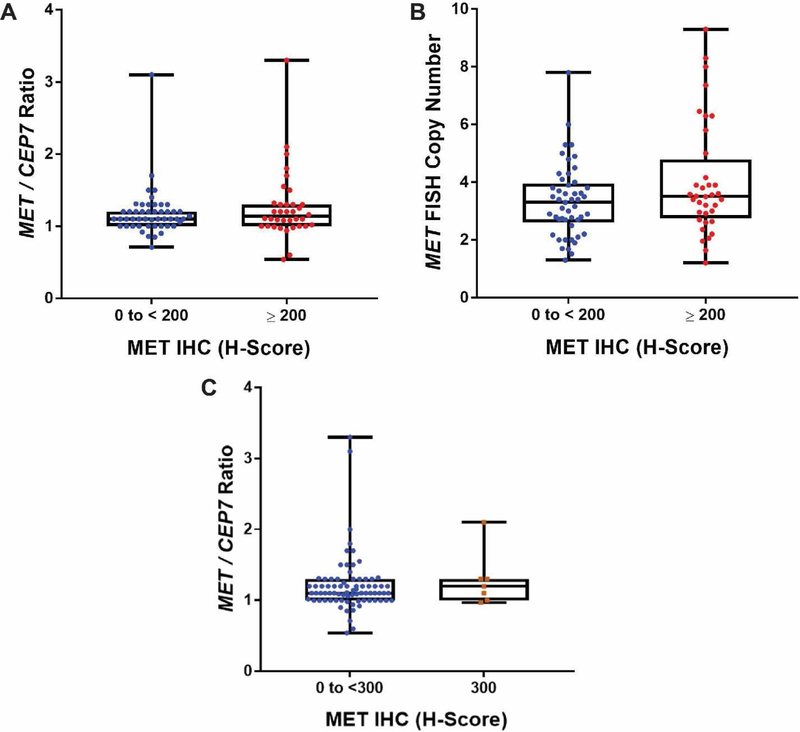
Figure 2. Box plot representations of MET/CEP7 ratios and MET FISH copy numbers compared to MET IHC H-Score.
Boxes represent the interquartile range, which contains 50% of the values, whereas lines extend the entire range of values. A) Median MET/CEP7 ratios of MET H-scores from 0 to < 200 (1.1, n=49) and ≥ 200 (1.135, n=36) are not significantly different (Mann Whitney test: p=0.57). B) Median MET FISH copy number from 0 to < 200 (3.3, n=49) and ≥ 200 (3.5, n=36) are also not significantly different (Mann Whitney test: p=0.2). C) Median MET/CEP7 ratios continue to overlap when comparing MET H-scores from 0 to < 300 (1.1, n=78) and the max score (300) (1.2, n=7) (Mann Whitney test: p=0.58).

