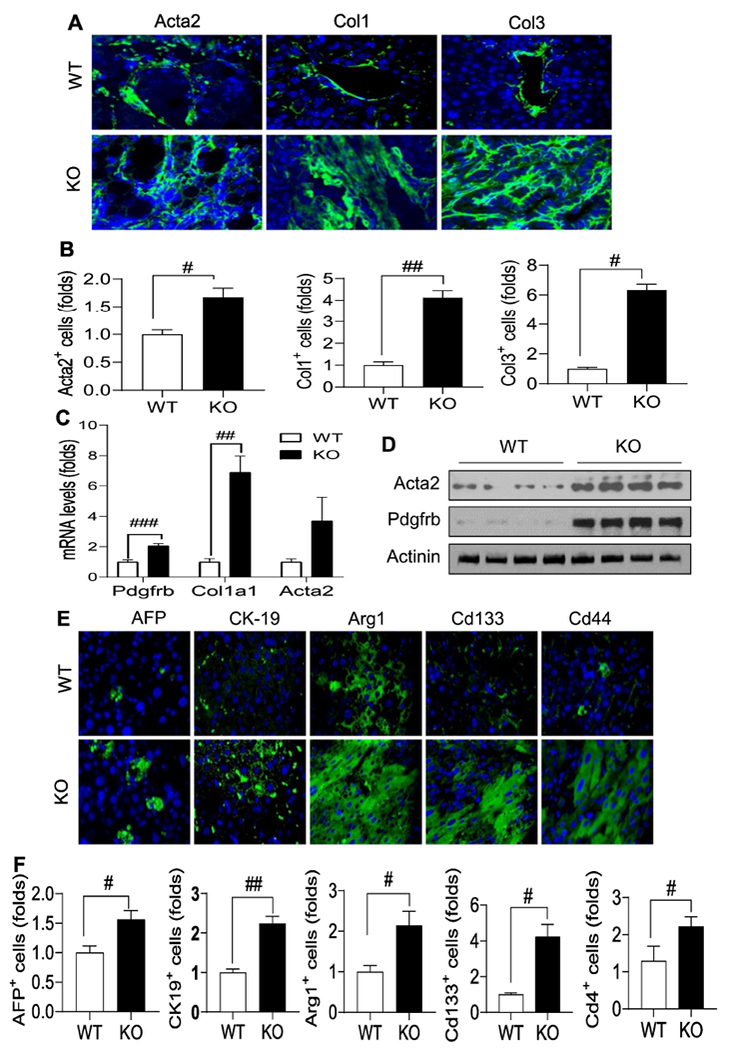
Fig 2. Sesn3 deficiency promotes HCC by enhancing the production of ECM and induction of CSC markers.

Representative immunofluorescence analysis of Acta2 (α-SMA), Col1, and Col3 (A). Analysis of fluorescence intensity for Acta2, Col1, and Col3 (B). Hepatic mRNA levels of Pdgfrb, Col1a1, and Acta2 (C). Immunoblot analysis of hepatic Acta2 and Pdgfrb (D). Representative immunofluorescence analysis of hepatic AFP, CK-19, Arg-1, Cd133, and Cd44 (E). Analysis of fluorescence intensity of hepatic AFP, CK-19, Argl, Cd133, and Cd44 (F). Data are expressed as mean ± SEM (n = 4 to 6 each group). #p < 0.05 and ##p < 0.01 for KO vs. WT. Immunofluorescence image analyses were performed using a fluorescence microscope (ZEISS, x200 magnification).
