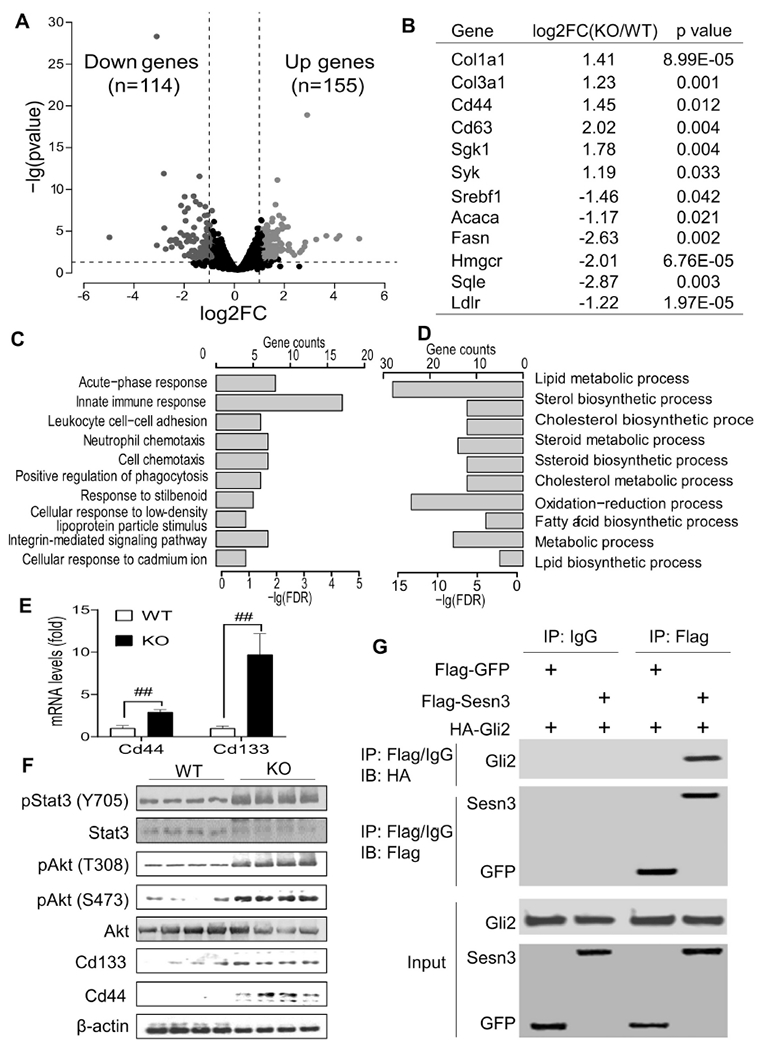
Fig 3. Sesn3 deficiency induced multiple cancer signaling pathways including the hedgehog pathway.

Differentially expressed genes (DEGs) from the RNA-seq analysis of WT and Sens3-KO livers were presented by the volcano plot (A). A selected list of DEGs were presented in the table (B). Top 10 biological processes were over-represented in the significantly upregulated (C) and downregulated (D) genes. Hepatic Cd44 and Cd133 mRNA analysis by real-time qPCR (E). Immunoblot analysis of cancer signaling-related proteins in the liver of WT and Sesn3 KO mice (F). Co-IP analysis of Sesn3 and Gli2 interaction in HEK 293T cells (G). Data are expressed as mean ± SEM (n=4 for the immunoblot analysis, n=10 for ELISA, n=6 for qPCR analysis, respectively). #p < 0.05 and ##p < 0.01 for KO vs. WT.
