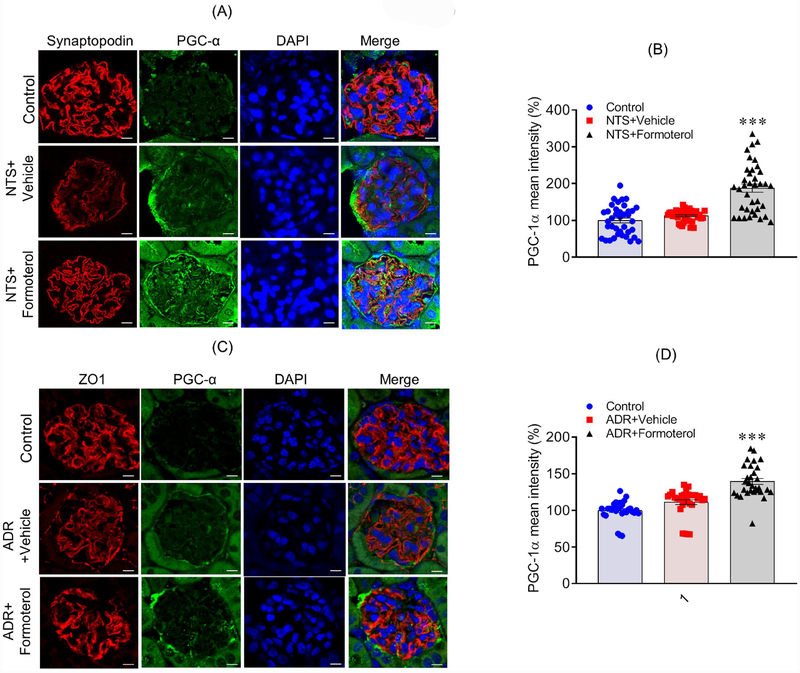
Figure 9: Formoterol treatment induced the expression of mitochondrial genes in mice glomeruli:
(A) Immunostaining analysis of kidney sections using PGC-1α (Green) and Synaptopodin (Red) antibodies and DAPI (Blue) showed increased PGC-1α staining in the NTS+formoterol treated mice. (B) The quantitative analysis of mean pixel intensity showed increased PGC-1α expression in the glomeruli of NTS+formoterol treated mice. Data are presented in mean±SEM. One-way ANOVA, ***P≤0.001 NTS+vehicle vs. NTS+formoterol. (C) Immunostaining with PGC-1α (Green) and Synaptopodin (Red) antibodies and DAPI (Blue) showed increased PGC-1α staining in the glomeruli of ADR+formoterol treated mice. (D) The quantitative analysis of mean pixel intensity showed increased PGC-1α expression in the glomeruli of ADR+formoterol treated mice. Data are presented in mean±SEM. One-way ANOVA, ***P≤0.001 NTS+vehicle vs. NTS+formoterol.

