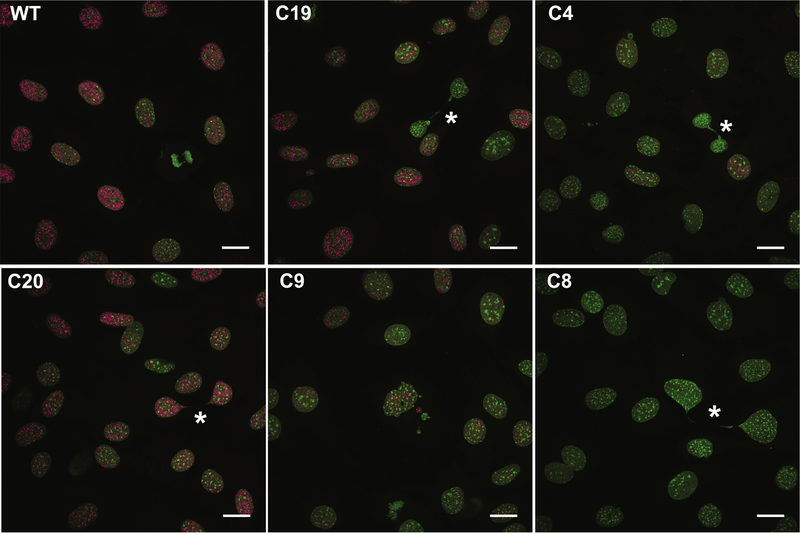
Figure 2: Mutations in Satb2 reduce protein levels.
Confocal maximum intensity projections showing representative Satb2 protein levels in undifferentiated (T0) cells of colonies used in this study. Note the presence of Satb2 protein in C4, indicating the production of a mutant protein, as well as the absence of protein in C8. DNA in green; Satb2 in pink. Asterisks highlight chromatin bridges. All scale bars represent 10 μm.

