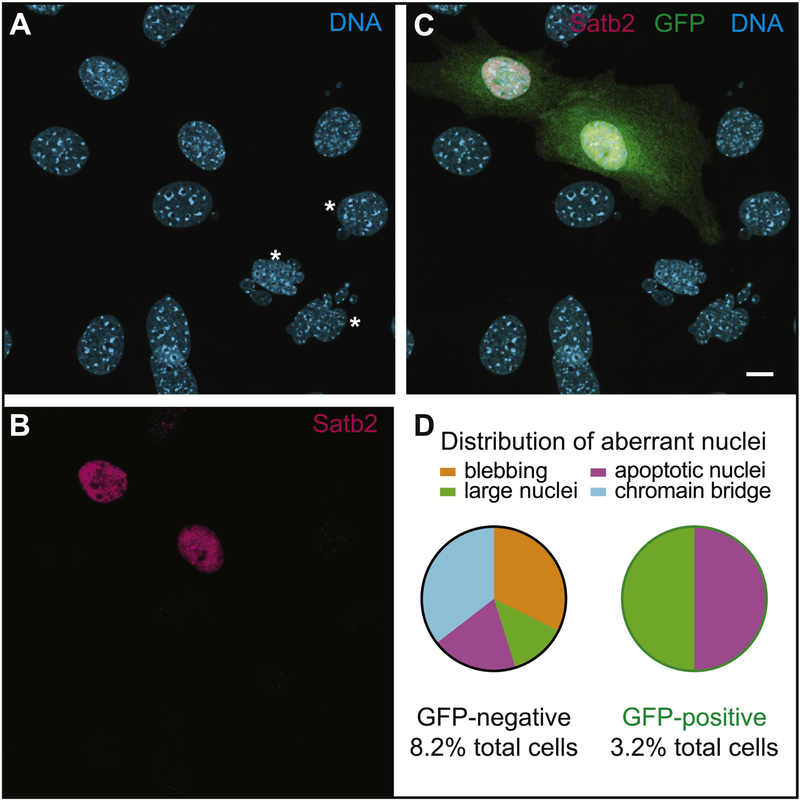
Figure 5: Over-expression of Satb2 in mutant cells reduces the frequency of abnormal nuclei.
Confocal images of C4 cells transfected with a Satb2-GFP over-expression plasmid. A) DNA stained with Hoechst. Asterisks highlight abnormal nuclei. B) Satb2 (magenta) is detected in nuclei of transfected cells. C) Overlay showing GFP-positive transfected cells. D) Pie-chart showing distribution of different types of nuclear aberrations observed in GFP-negative and GFP-positive C4 cells. Scale bar represents 10 μm.

