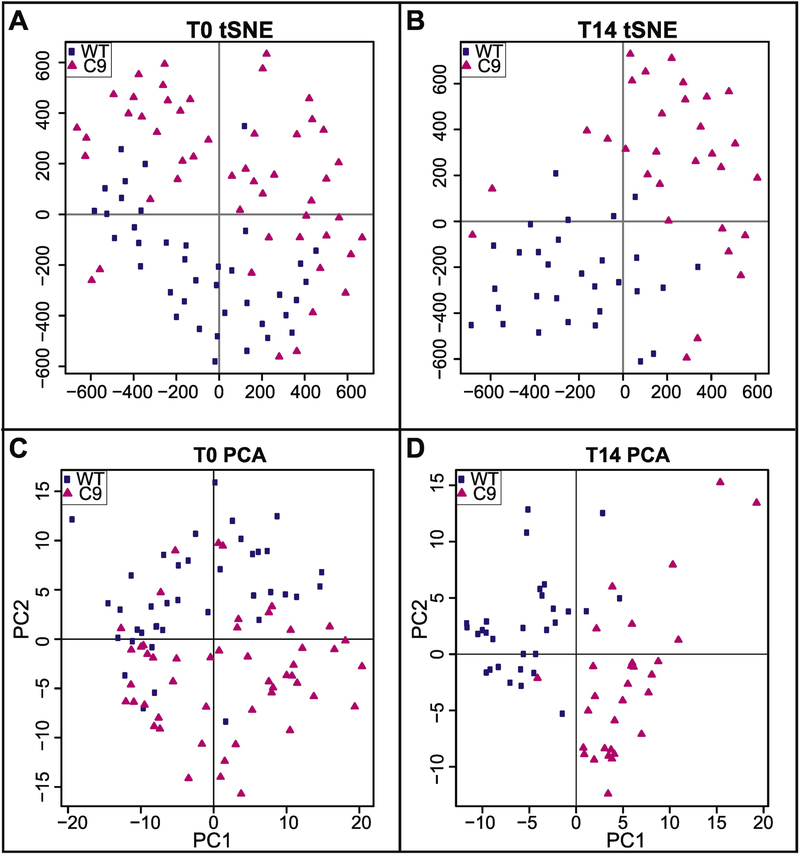
Figure 7: Reduction in Satb2 increases gene expression variance.
Upper panels show t-distributed Stochastic Neighbor Embedding (tSNE) plots of single cell gene expression in wild-type (WT; blue squares) and colony 9 (C9; pink triangles) cells at A) T0 (initial dimensions= 80, perplexity=15, iterations 4000, error was 0.528 at the 4000th iteration) and B) T14 (initial dimensions= 80, perplexity=10, iterations 3000, error was 0.524 at the 3000th iteration). Lower panels show plots of principal components 1 and 2 from Principal Components Analysis (PCA) on single cell gene expression in WT (blue squares) and C9 (pink triangles) cells at C) T0 and D) T14.

