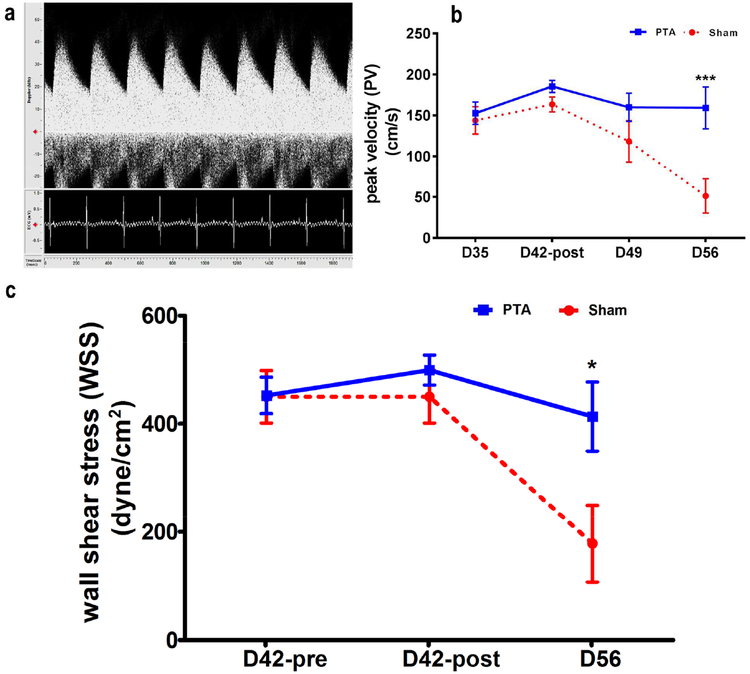
Figure 2: Peak velocity (PV) and wall shear stress (WSS).
A is representative image of the Doppler signal from the jugular graft vein is shown with arterial and spectral broadening waveform. (b) By day 56, there is a significant increase in the average peak velocity (PV, ***P<0.001) and (c) WSS of the PTA vessels compared with sham vessels (*P<0.05).

