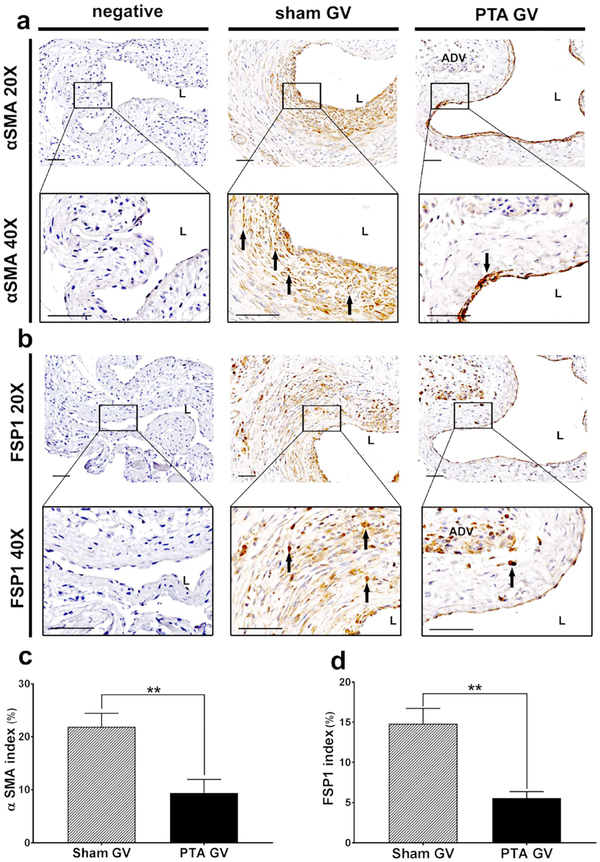
Figure 3: Immunohistochemical staining for α-SMA and FSP-1.
A upper row is representative sections at 20X magnification and b lower row is at 40X magnification after α-SMA staining of the negative control (negative), sham jugular graft vein (sham GV), and PTA treated jugular graft vein (PTA GV). Qualitatively, there is reduced α-SMA staining in the PTA GV compared to the sham. B upper row are representative sections at 20X magnification and b lower row is at 40X magnification after FSP-1 staining of the negative, sham GV, and PTA GV. Qualitatively, there is reduced FSP-1 staining in the PTA GV compared to the sham. (c) There is a significant reduction in the α-SMA index of the PTA GV compared to sham controls (**P<0.01). (d) There is a significant reduction in the FSP-1 index in the PTA GV compared to sham controls (**P<0.01). Each bar represents mean ± SEM of 6–7 animals. ADV, adventitia; L, lumen. Scale bar is 50-μm.

