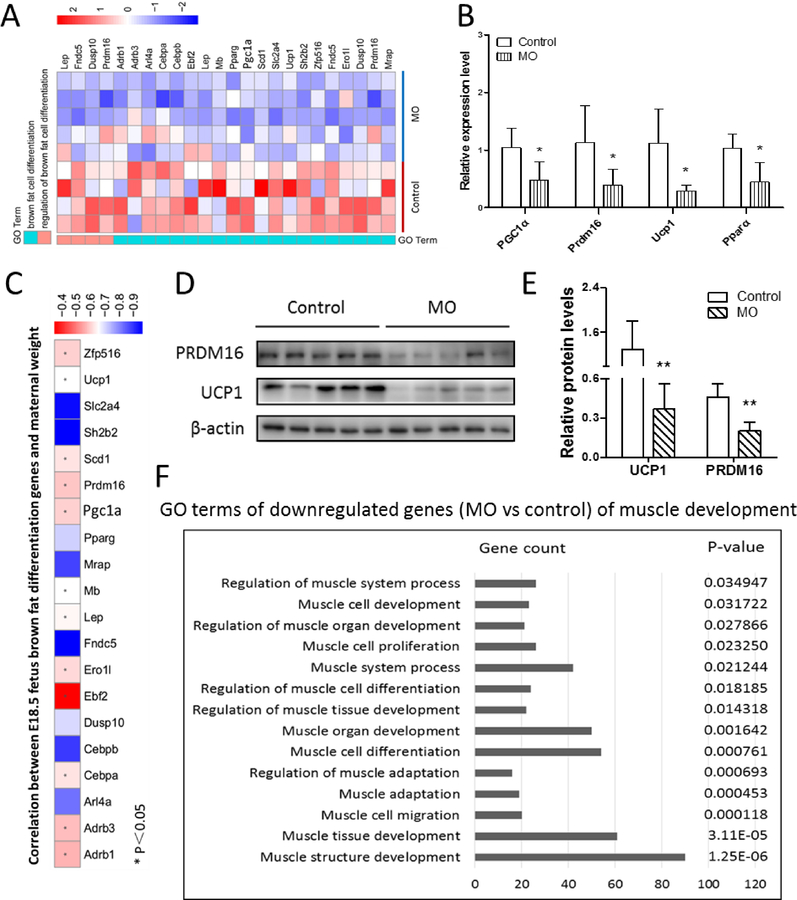
Figure 3. MO negatively affected E18.5 fetal brown adipogenesis.
(A) Heatmap of the expression of selected genes associated with BAT development. (B) Quantitative real-time PCR analyzed the expression of genes selected by heatmap (n=5 per group). (C) Pearson correlation of brown adipocyte differentiation markers and maternal weight. (D and E) Western blotting analysis of PRDM16 and UCP1 contents (D) and relative quantitative analysis (E) of protein bands (n=5 per group). (F) GO terms of down-regulated genes of muscle development.*p≤0.05 versus control, **p≤0.01 versus control.

