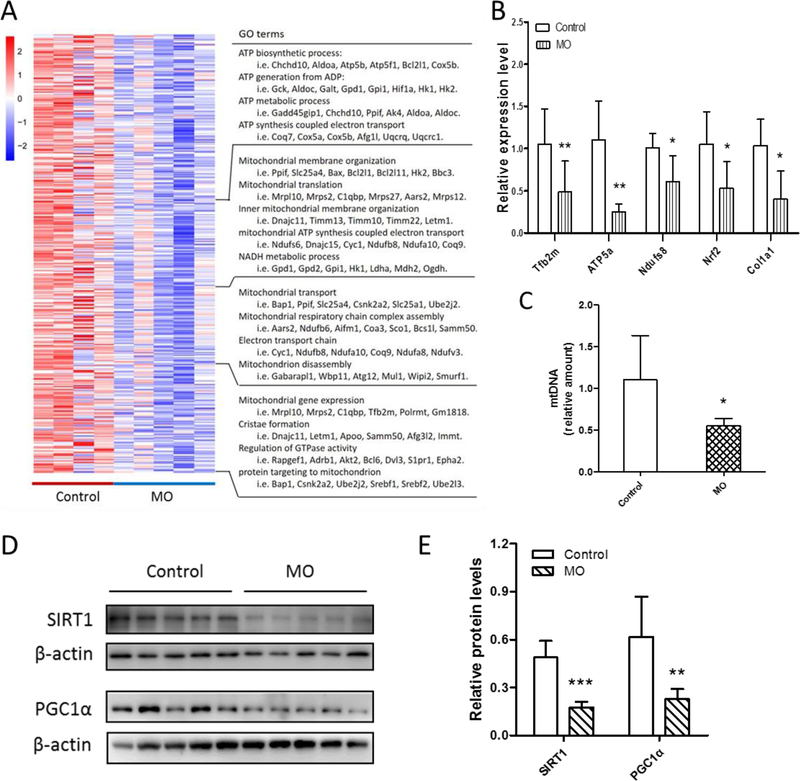
Figure 4. MO negatively affected E18.5 fetal mitochondriogenesis.
(A) Heatmap of the expression of selected genes associated with mitochondriogenesis. (B) Quantitative real-time PCR analyzed the expression of genes selected by heatmap (n=5 per group). (C) Mitochondrial DNA content in control and MO fetal BAT analyzed by quantitative real-time PCR. (D and E) Western blotting analysis of SIRT1 and PGC1α contents (D) and relative quantitative analysis (E) of protein bands (n=5 per group). *p≤0.05 versus control, **p≤0.01 versus control, ***p≤0.001 versus control.

