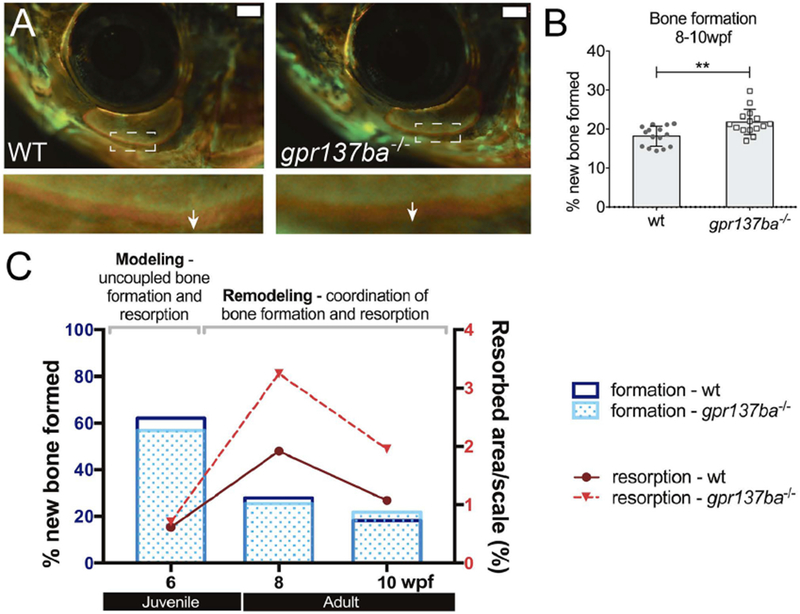
Figure 6. Effect of gpr137ba−/− on skeletal homeostasis during zebrafish development.

Bone formation in gpr137ba deficient fish as measured by differential fluorophore incorporation (A) Representative images showing the infraorbital bone 3 (IO3) on live fish. Inset shows the difference between red and green staining (white arrow) representing the new bone formed in 14 days. Scale bar: 1mm. (B) Quantification of new bone formed during 14 days in IO3. Graph represents mean ± SD, data points represent the average between left and right IO3, **p<0.01, unpaired Student’s t-test. (C) Model showing changes in bone homeostasis during development in wild type and gpr137ba−/− zebrafish. Juvenile fish show an initial phase of bone modeling characterized by uncoupled bone formation and bone resorption. At this age, bone formation largely supersedes bone resorption. When fish reach adulthood, the rate of bone formation gradually decreases while bone resorption increases. During this phase, bone formation and resorption are coupled in space and time. Detailed bone formation and resorption data during wild type and gpr137ba−/− zebrafish growth is shown in supplemental figure 3.
