
Figure 1.
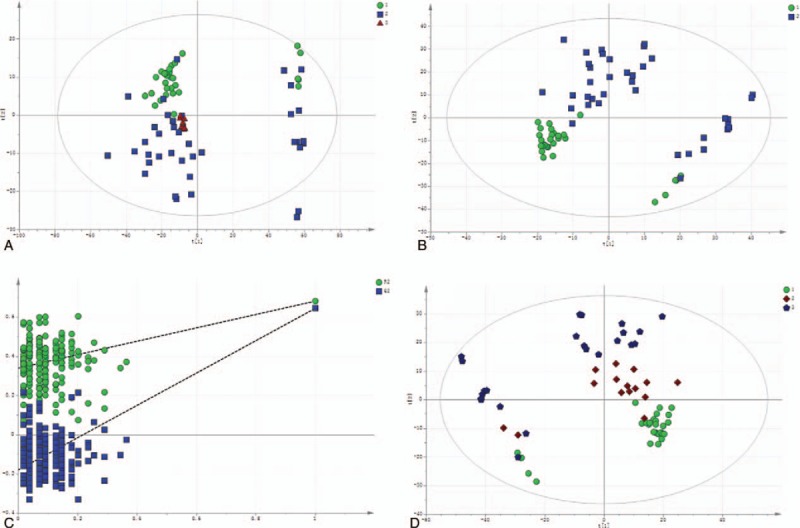
The multivariate statistical analysis of serum profiling data generated in positive ion mode. (A) Plots of the principal component analysis (PCA) scores of peaks detected in the positive ion mode. 1: healthy control; 2: DILI; 3: quality control. (B) Scatter plots of the partial least squares-discriminant analysis (PLS-DA) with a positive ion model of serum obtained from patients with DILI and healthy controls. 1: healthy control; 2: DILI. (C) Validation plot of the original PLS-DA with a positive ion model, strongly indicating that the original model was valid and revealed no signs of overfitting. The permutation test was repeated for 200 times in the cross-validation plot. (D) The plots of PCA scores of the peaks detected in the positive ion mode using serum samples obtained from patients in the mild and severe injury groups. 1: healthy control; 2: mild DILI; 3: severe DILI.