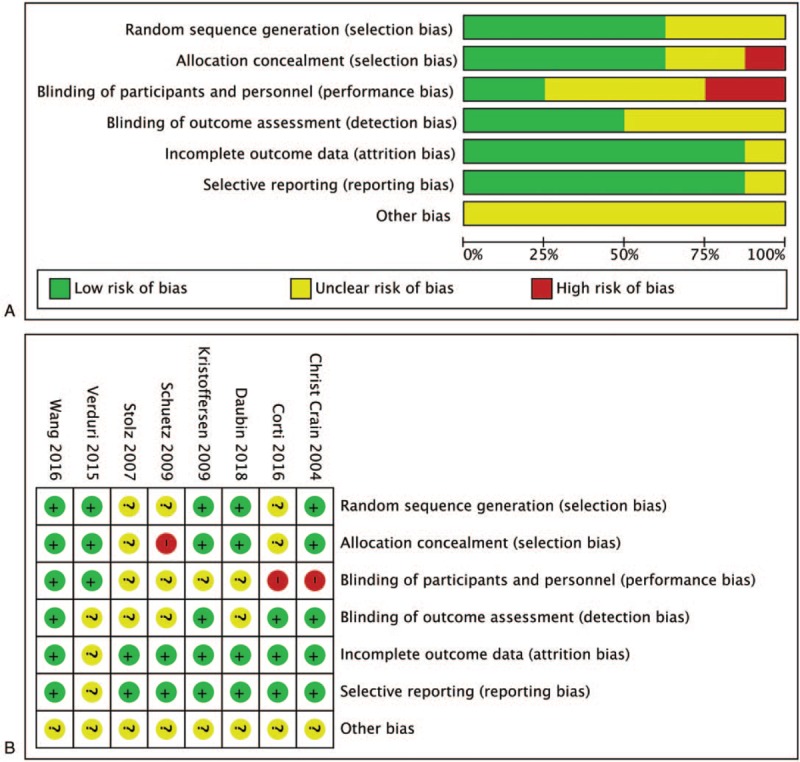
Figure 2.

Risk of bias graph (A) and risk of bias summary (B) review authors’ judgments about each risk of bias item for each included study. Green indicates low risk of bias, yellow indicates unclear risk of bias, and red indicates high risk of bias.
