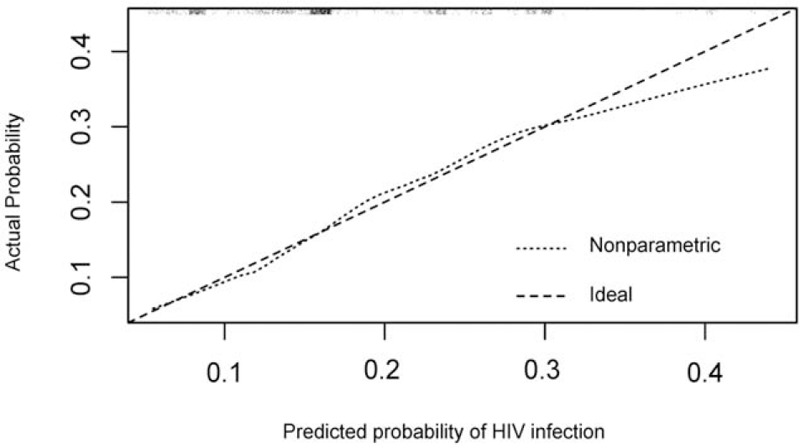
Figure 2.

The calibration of the HIV risk assessment tool, when applied to the external validation cohort. The plot illustrates the agreement between predicted and observed probability of HIV infection. The ideal line is a 45° line, which shows perfect concordance between the observed and predicted probabilities. The nonparametric line and the ideal line overlap in low predicted probabilities for HIV infection, but the disagreement appears when the predicted probability grows higher, indicating the tool-based (nonparametric) predicted probability overestimates an individual's actual probability of HIV infection. HIV = human immunodeficiency virus.
