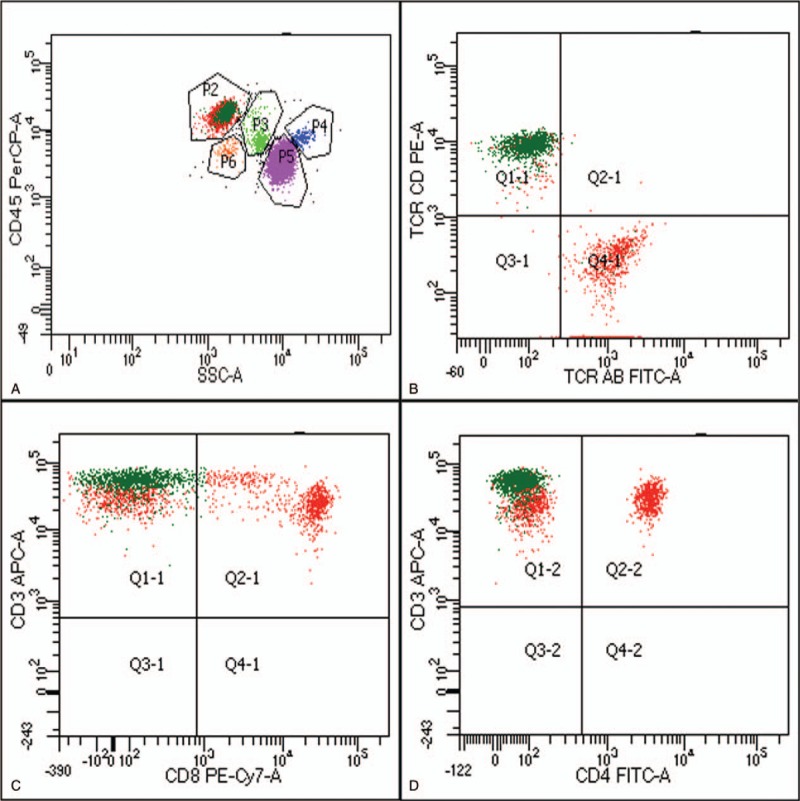
Figure 3.

The results of peripheral blood flow cytometry. (A) CD45/SSC gating showed 40% lymphocytes (P2) and 16% CD3+ CD4− CD8− abnormal T lymphocytes (dark green dots, P3); (B) The abnormal T lymphocytes (dark green dots) were CD3+ CD8−; (C) The abnormal T lymphocytes (dark green dots) were CD3+ CD4−; (B) The abnormal T lymphocytes (dark green dots) were TCRγδ+ and TCRαβ- (P.S.TCR AB = TCRαβ, TCR CD = TCR γδ).
