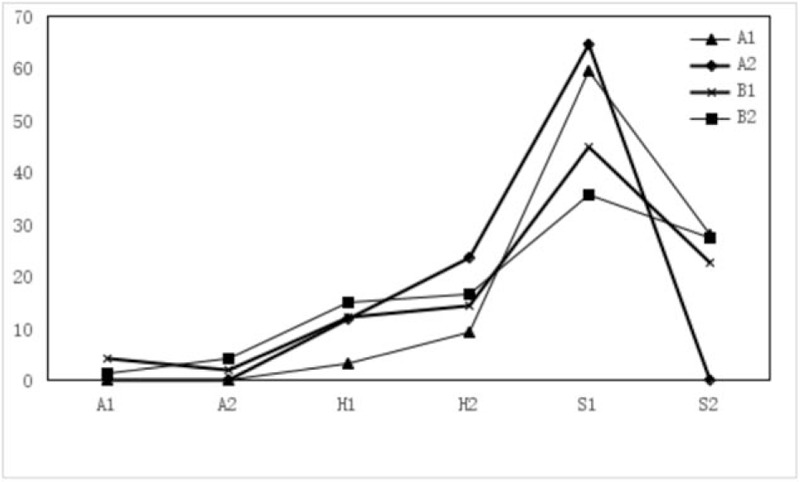
Figure 3.

The F-figure for ulcer staging ratio of 2 months after ESD in Groups A1, A2, B1, B2. There was significant difference in ulcer stage between Group A1 and Group A2 [stage H1: 1 vs 3 case (3.13% vs 17.65%), stage H2: 3 vs 4 case (9.38% vs 23.53%)] (P < .05), but there was a statistically significant difference in the stage S2 between Group A1 and Group A2 (P < .05). In Groups B1 and B2, it still had few patients in stage A1 (4.08%, 1.37%), A2 (2.04%, 4.11%). But Group A1 and Group A2 did not have patients in stage A. Group A1 had better stages than Group A2 (P = .036), Groups B1 (P = .046), and B2 (P = .039).
