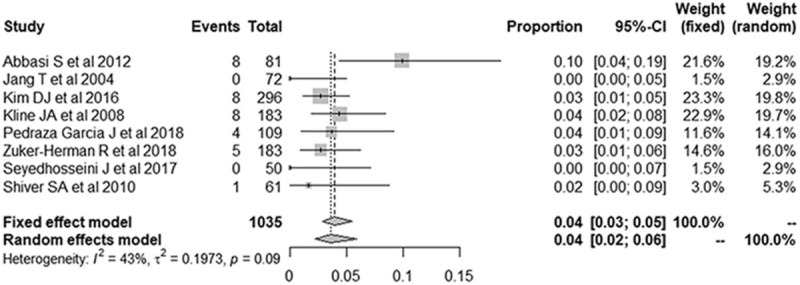
Figure 8.

Forest plots of the false-negative rate of the 3-point point-of-care ultrasound for the diagnosis of deep vein thrombosis. Numbers are pooled estimates with 95% confidence intervals (95% CIs) in parentheses. Horizontal lines indicate 95% CIs, and the black box on each line indicates the standardized mean difference for each study. The black diamond at the bottom of the plot indicates the average effect size of the included studies.
