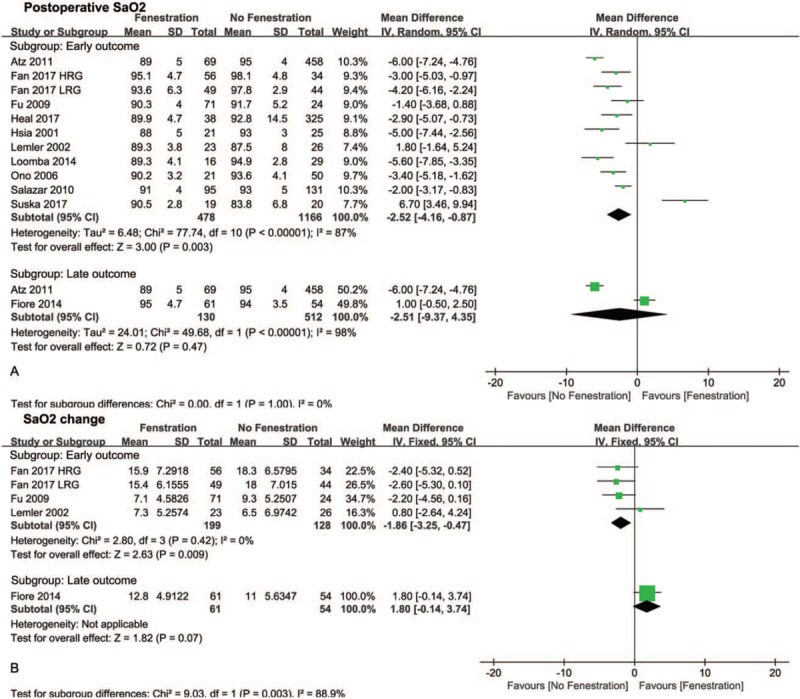
Figure 2.

Forest plots of postoperative SaO2 (A) and SaO2 change before and after Fontan procedure (B). HRG = high risk group, LRG = low risk group, SaO2 = oxygen saturation.

Forest plots of postoperative SaO2 (A) and SaO2 change before and after Fontan procedure (B). HRG = high risk group, LRG = low risk group, SaO2 = oxygen saturation.