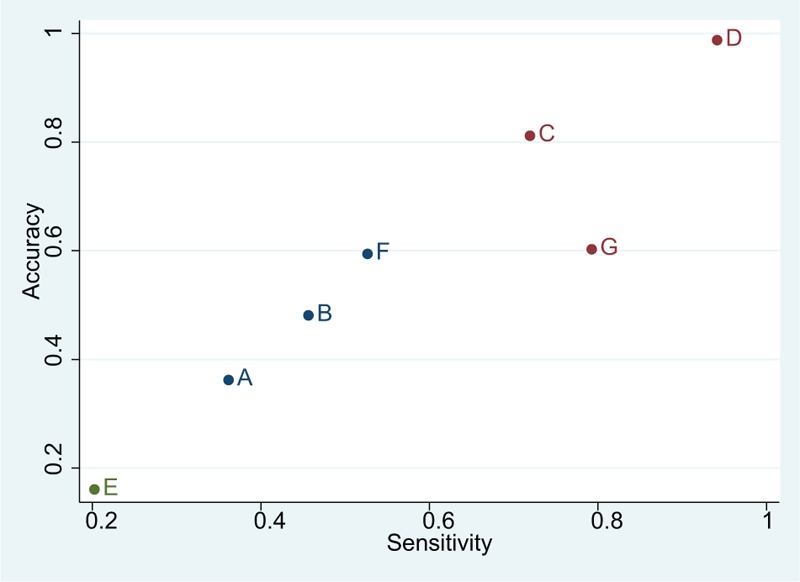
Figure 4.

Cluster ranking plots of sensitivity and accuracy for the diagnostic values of ischemic stroke. A = traditional computed tomography, B = computed tomography angiography, C = computed tomography perfusion, D = diffusion-weighted imaging, E = magnetic resonance angiography, F = traditional magnetic resonance imaging, G = transcranial Doppler ultrasound.
