
Figure 2.
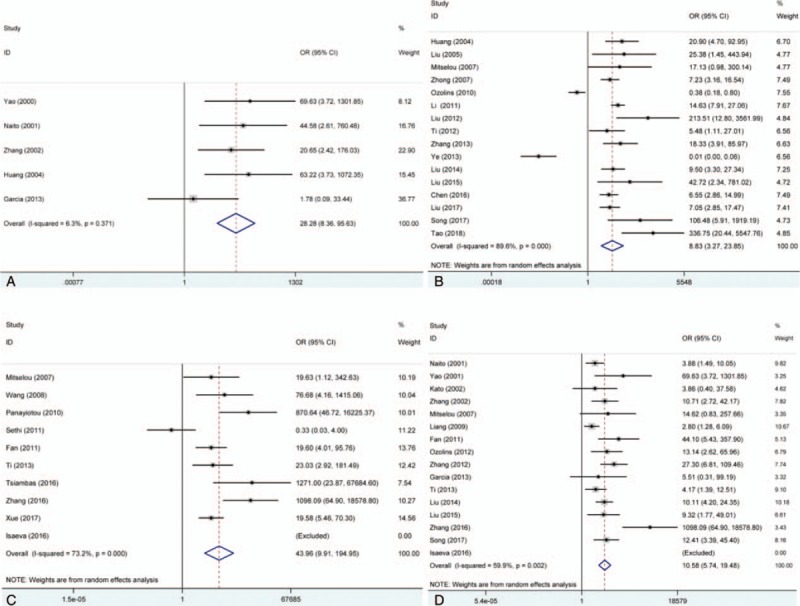
Forest plot of the association between E-cadherin expression and risk of thyroid cancer. (A) Normal thyroid tissue vs. thyroid cancer tissue; (B) adjacent thyroid tissue vs. thyroid cancer tissue; (C) benign thyroid tissue vs. thyroid cancer tissue; and (D) thyroid adenoma tissue vs. thyroid cancer. CI = confidence intervals, OR = odds ratios.