
Figure 4.
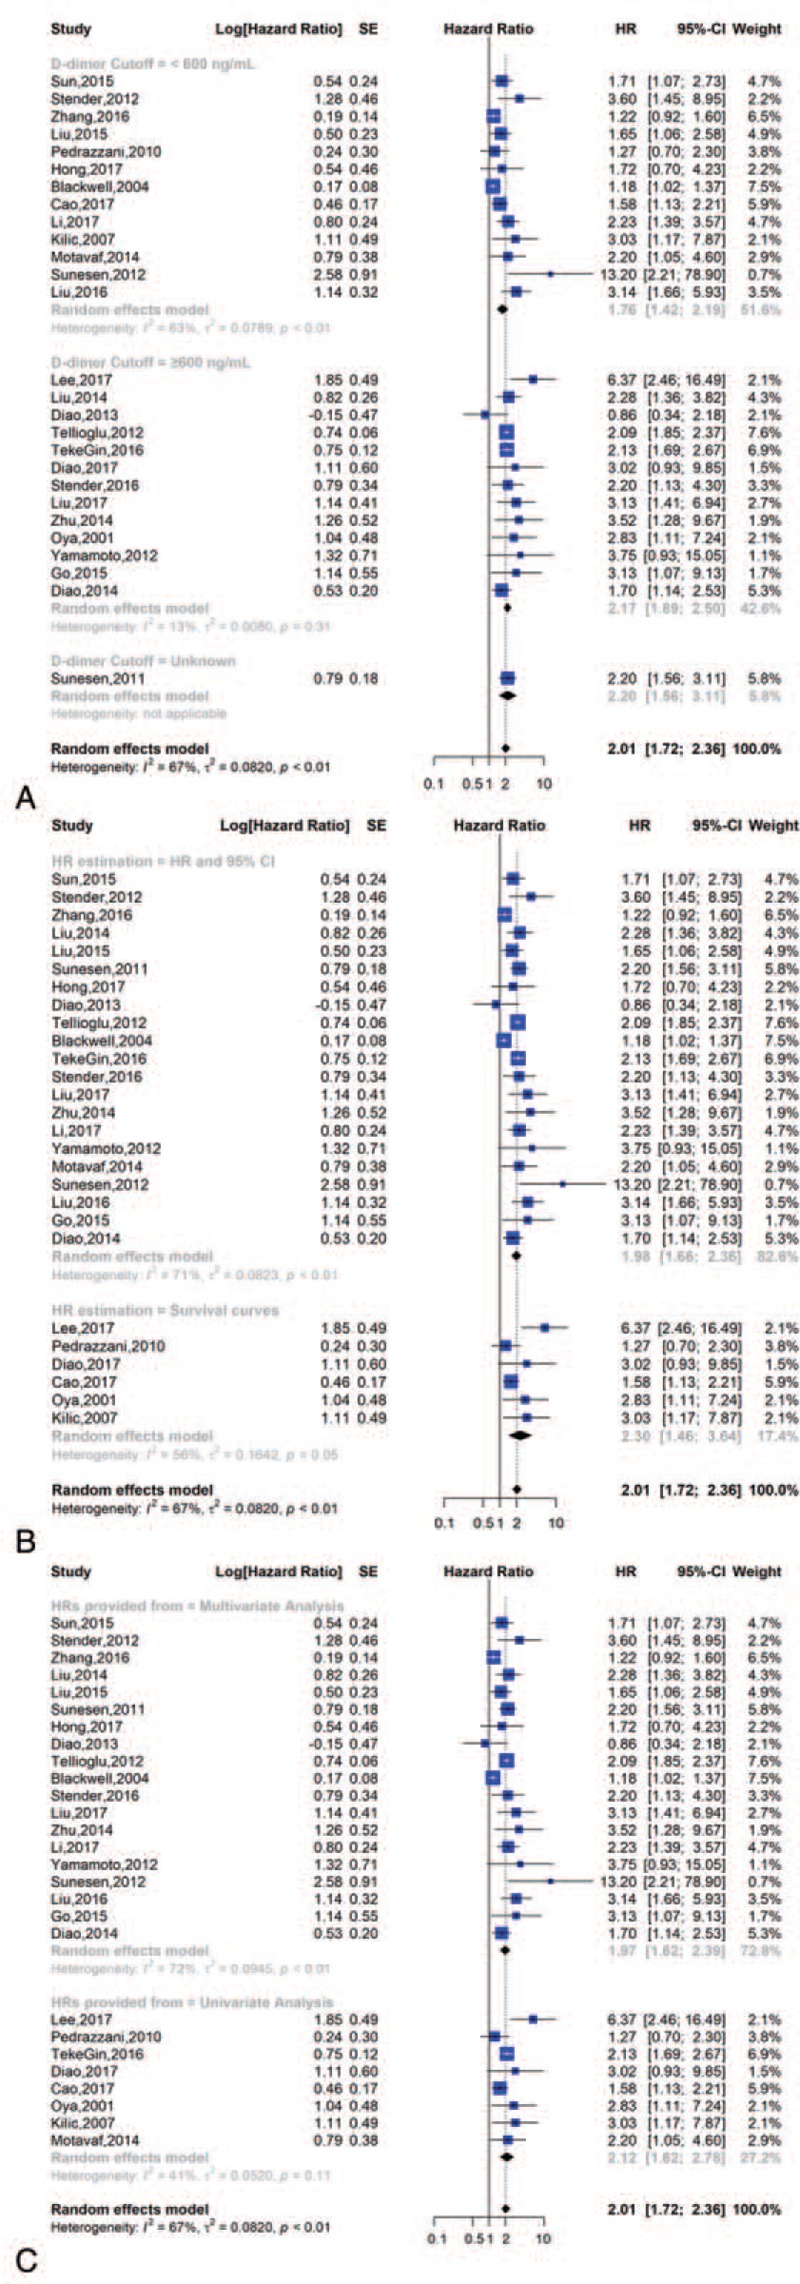
Subgroup analysis of overall survival; (A) forest plot of D-dimer cut-off value; (B) forest plot of HR estimation; (C) forest plot of HRs provided from.
Official websites use .gov
A
.gov website belongs to an official
government organization in the United States.
Secure .gov websites use HTTPS
A lock (
) or https:// means you've safely
connected to the .gov website. Share sensitive
information only on official, secure websites.
Subgroup analysis of overall survival; (A) forest plot of D-dimer cut-off value; (B) forest plot of HR estimation; (C) forest plot of HRs provided from.