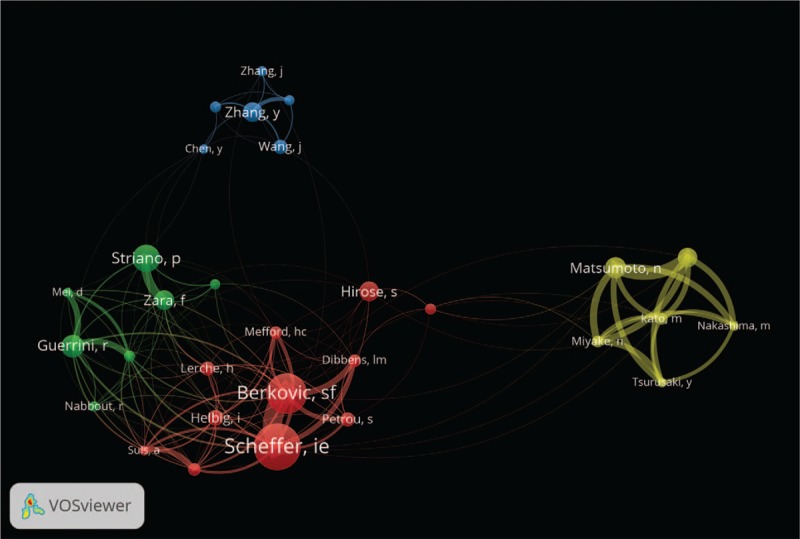
Figure 3.

Network visualization map of active authors in epilepsy genetics research. Top 30 authors were visualized. Because of names overlapping, some names might be invisible. The thickness of connecting line between any 2 authors indicates the strength of collaboration. For example, Scheffer, Berkovic, and Helbig existed in one cluster and had the highest percentage of collaboration within this cluster. Petrou, Suls, Ierche, Mefford, and Dibbens were clustered in red since the bulk of their collaboration is with the each other.
