
Figure 5.
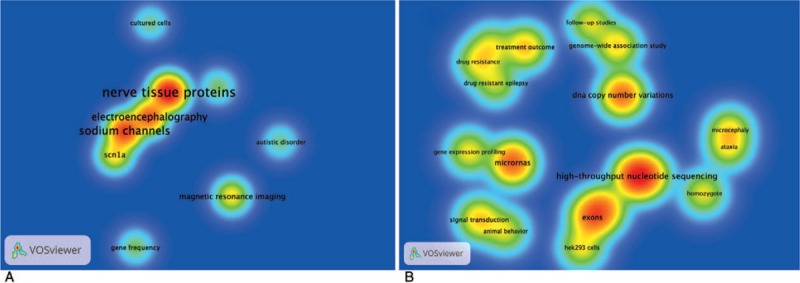
Density visualizations of VOSviewer maps. 2009 to 2013 group (A), 2014 to 2018 group (B). After splitting the data pool into 2009 to 2013 group and 2014–2018 group, we drew the density visualizations of the 2 groups independently by the unique high-frequency MeSH terms according to the T value respectively.