
Figure 3.
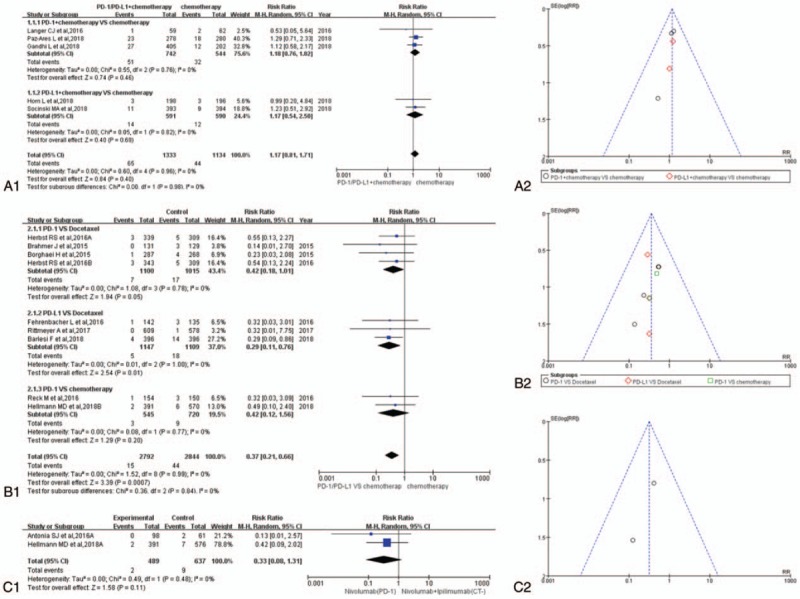
Forest plots and funnel plots for the risk ratio of overall treatment-related adverse events. (A1) Forest plots for the risk ratio of overall treatment-related adverse events (PD-1/PD-L1 + chemotherapy vs. chemotherapy). (A2) Funnel plots for the risk ratio of overall treatment-related adverse events (PD-1/PD-L1 + chemotherapy vs. chemotherapy). (B1) Forest plots for the risk ratio of overall treatment-related adverse events (PD-1/PD-L1 vs. chemotherapy). (B2) Funnel plots for the risk ratio of overall treatment-related adverse events (PD-1/PD-L1 vs. chemotherapy). (C1) Forest plots for the risk ratio of overall treatment-related adverse events (nivolumab vs. nivolumab + ipilimumab). (C2) Funnel plots for the risk ratio of overall treatment-related adverse events (nivolumab vs. nivolumab + ipilimumab). PD-1 = programmed cell death 1, PD-L1 = programmed cell death ligand 1.