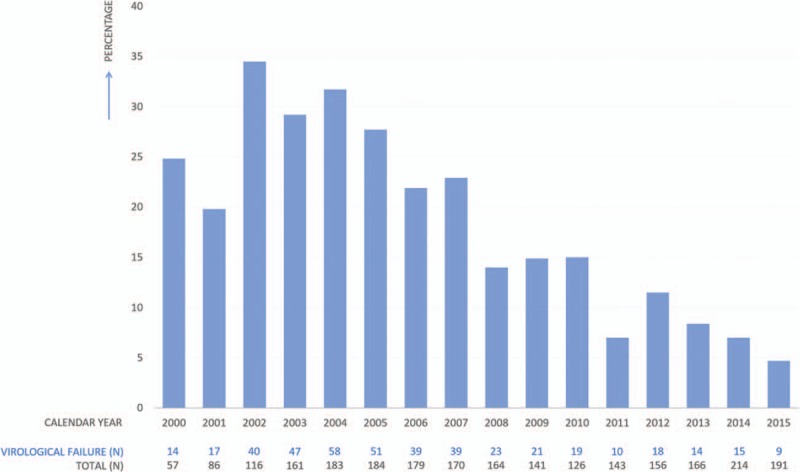
Figure 2.

Proportion of young adults (18–24 years) experiencing virological failure per calendar year. This graph represents a cross-sectional view of the percentage of study participants experiencing virological failure per calendar year. The absolute numbers of participants for which data was available per year are displayed below the graph.
