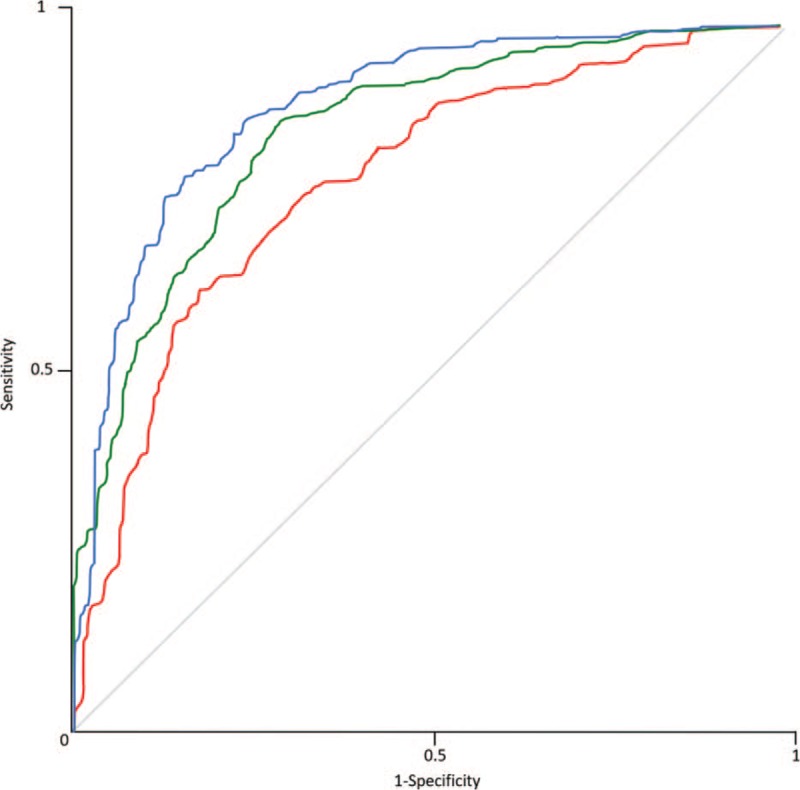
Figure 2.

ROC analysis curves of artificial neural network with 10-fold cross-validation averaged for standard and low dose CT by reconstruction type: Filtered Back Projection (Blue), SAFIRE strength level 3 (Green), and SAFIRE strength level 5 (Red). Note the highest AUC at FBP reconstructed images. AUC = area under the curve, CT = computed tomography, ROC = receiver operating characteristics, SAFIRE = Sinogram Affirmed Iterative Reconstruction.
