Table 3.
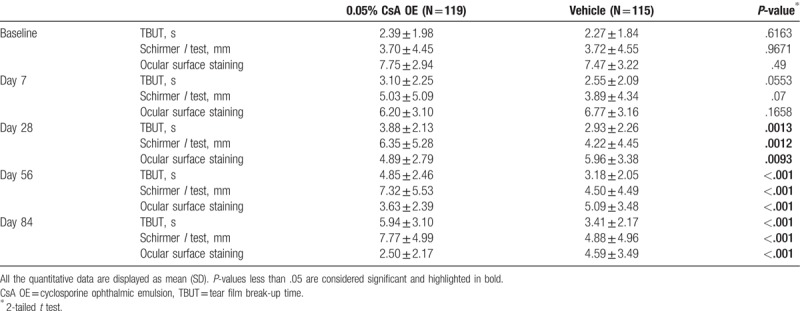
Comparison of tear film break-up time, Schirmer I test and ocular surface staining score (Oxford scheme) between 0.05% CsA OE group and vehicle group at different time points during the study in the full analysis set.

Comparison of tear film break-up time, Schirmer I test and ocular surface staining score (Oxford scheme) between 0.05% CsA OE group and vehicle group at different time points during the study in the full analysis set.
