Figure 2.

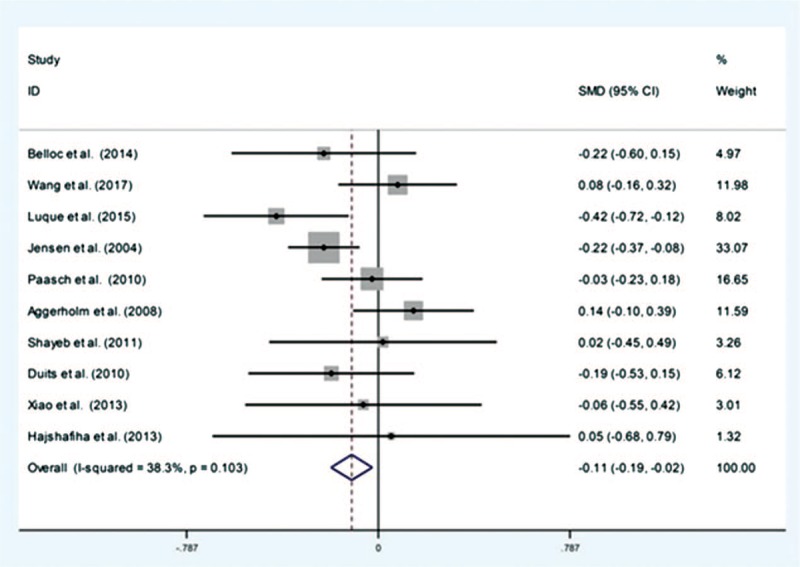
Forest plot of total sperm count of low body mass compared with normal body mass. Each point represents a separate study for the indicated association.

Forest plot of total sperm count of low body mass compared with normal body mass. Each point represents a separate study for the indicated association.