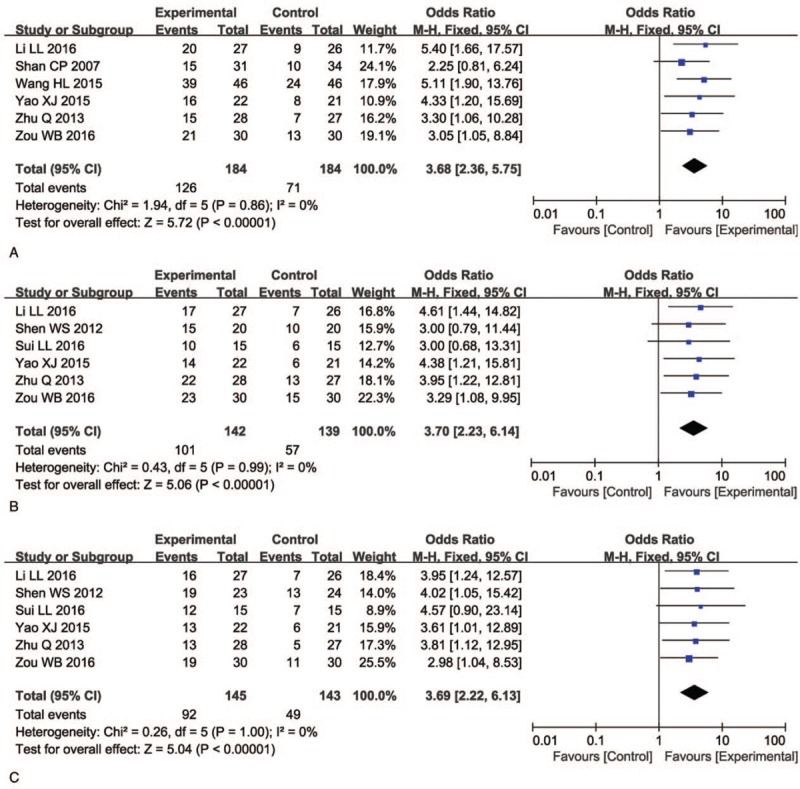
Figure 7.

Forest plot of the comparison of quality of life improved rate (QIR, A), pain relief rate (PRR, B) and weight gain rate (WGR, C) between the experimental and control group. Control group, radiochemotherapy alone group; Experimental group, KLT injection and radiochemotherapy combined group. The fixed-effects meta-analysis model (Mantel–Haenszel method) was used.
