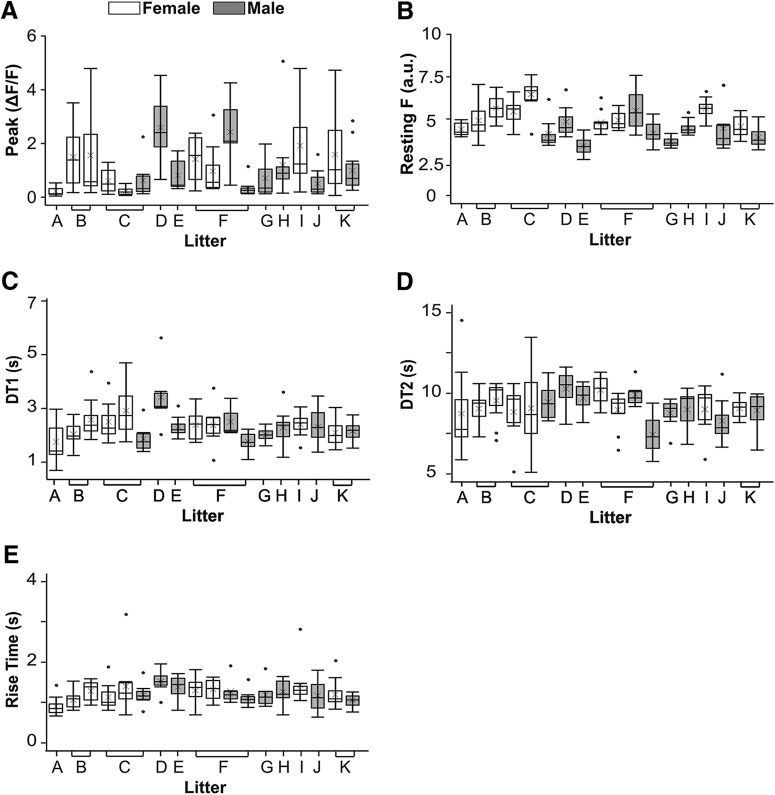
Figure 4.
Variation in calcium transients between cells, animals, and sexes. Each box plot represents data from 7–15 cells from one animal. Animals are grouped together by litter (labeled A-K). Shaded boxes indicate males and empty boxes indicate females. For each box plot: lower bar = first quartile, box bottom = 2nd quartile, horizontal line = median, x = mean, box top = 3rd quartile, top bar = 4th quartile, circles outside plot = data more or less than 1.5 times the interquartile range (box). A, Tall boxes and bars demonstrate that the peak amplitudes of calcium transients varied from cell to cell. Differing medians, means, and box heights show that peak amplitudes also varied from animal to animal. There are no differences between males and females or litters in the distribution or variability of peak amplitudes. B, In contrast to peak amplitude, resting fluorescence (Resting F; plotted as PMT a.u./100) is more consistent across cells, animals, and sexes. C–E, RT, DT1, and DT2 also demonstrate less variability between cells and animals than peak amplitude.

