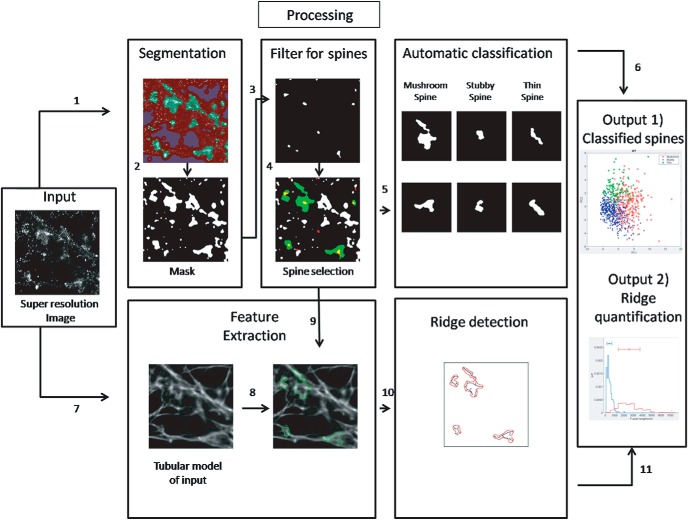
Figure 1.
Schematic representation of the workflow for generating an objective classification of F-actin organization in dendritic spines. The super-resolution image of F-actin generated using dSTORM microscopy is considered as the input. (1) Using the TWS on input, a segmented image was created. (2) The segments of interest were color coded and a binary image was obtained for F-actin-enriched regions (mask). (3) The super-resolution image of Homer 1c was generated for the same region of interest as that of input. (4) The segmented image of input was spatially correlated with the postsynaptic marker Homer 1c to select for dendritic spines; please refer to Extended Data Fig. 1-1 for a detailed work flow for steps 1-4. (5) The spines obtained from step 4 were further categorized as mushroom, stubby, and thin using supervised learning. (6) The final data were categorized and plotted into different classes as output 1. (7) The tubular model of the input image was generated using ANNA-PALM. (8, 9) Two processing steps were converged to understand the nanoscale distribution of F-actin in dendritic spines generated from the tubular model, which was spatially correlated with Homer 1c-positive regions obtained in step 4. (10) Spine-specific ridges were extracted in the regions identified positive for excitatory synapses; please refer to Extended Data Fig. 1-2 for a detailed work flow for steps 8-10. (11) The spine-specific parameters of the ridges were measured and plotted as output 2.

