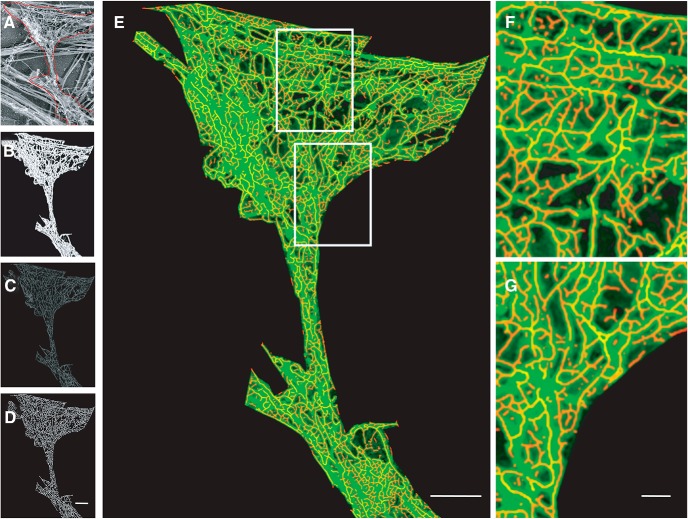
Figure 3.
Analysis of nano-organization of F-actin at 1-nm/px sampling. A, PREM image of cytoskeletal distribution within a spine. Scale bar = 200 nm. B, The segmented image selecting only the thin filaments in PREM indicate the F-actin distribution. C, ANNA-PALM simulation of the F-actin network using tubular model. D, Extraction of ridges by skeletonizing the ANNA-PALM image. E, Overlay of an image obtained by PREM (green) and ridges that mark the F-actin network (red) of the spine. Scale bar = 200 nm. F, G, Magnified views of sections within the spine; please refer to Extended Data Fig. 3-1 for a comparative analysis between PREM and simulated super resolved images. The ridges overlapped with the PREM images with a correlation of >89%. Scale bar = 50 nm.

