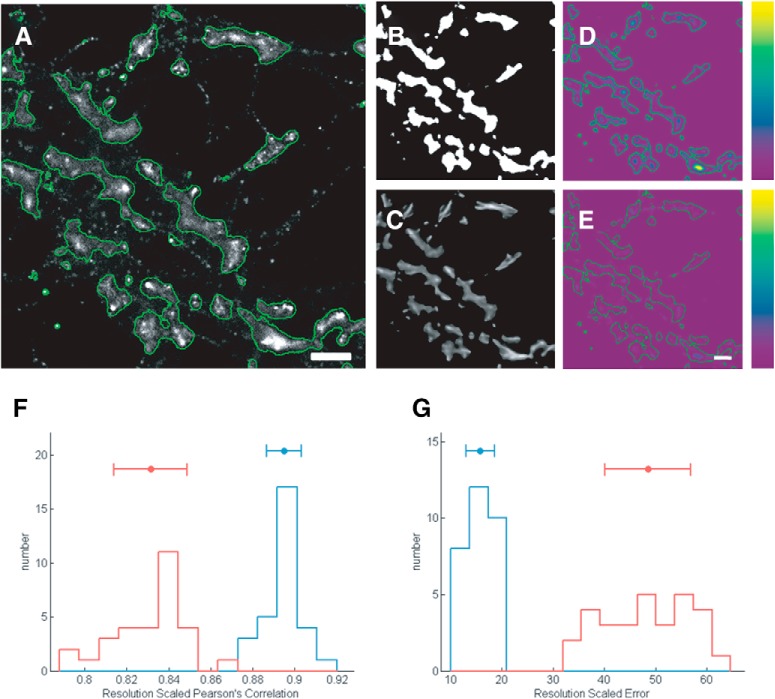
Figure 4.
Tubular model of F-actin represents its actual distribution in spines. A, Super-resolution image of F-actin in neurons obtained by dSTORM. Scale bar = 1 μm. B, Mask of F-actin rich compartments in neuronal processes. C, Tubular model of F-actin obtained by ANNA-PALM. D, RSE maps indicating the correlation between dSTORM image and F-actin mask. E, RSE maps of the dSTORM image with a tubular model of F-actin. Scale bar = 1 µm. The pseudocolor bar ranging from purple to yellow indicates low to high error. G, RSP of dSTORM image with the F-actin mask (red) and with the tubular model of F-actin from ANNA-PALM (blue). I, RSE of the dSTORM image with the F-actin mask (red) and with the tubular model of F-actin from ANNA-PALM (blue).

